
Advanced Guide to Candlestick Patterns in Trading
📈 Master advanced candlestick patterns in trading! Learn complex signals, risk management, and how to combine candlestick analysis for smarter market moves in Pakistan.
Edited By
Benjamin Clarke
Candlestick patterns form the backbone of technical analysis in trading, offering clear visual cues about market sentiment. For traders and investors in Pakistan, understanding these patterns can significantly improve decision-making in stocks, forex, and cryptocurrencies alike.
Candlesticks represent price movements for a specific period, showing the open, close, high, and low prices. Patterns emerge when multiple candles form distinctive shapes that hint at a potential price direction. Some common examples include the Doji, indicating indecision, or the Engulfing Pattern, which suggests a possible trend reversal.
Successful trading revolves around recognising these patterns quickly and applying them wisely. For instance, spotting a Bullish Engulfing near support might signal a buying opportunity, whereas a Shooting Star near resistance could warn to sell or tighten stops.
Note that candlestick analysis should not work in isolation. Markets can be unpredictable, so combining candlestick signals with support/resistance levels, trading volume, and other indicators like the Relative Strength Index (RSI) generally yields better results.
Risk management plays an equally important role. Even the most reliable candlestick pattern can't guarantee profits. Traders should set clear stop-loss orders, position sizes per their risk appetite, and validate patterns within broader market contexts.
This article provides practical steps to identify key candlestick formations and apply them in live trading. We also suggest reliable PDF guides and resources tailored for Pakistani traders wanting to deepen their understanding gradually—from basics to advanced setups.
In Pakistan's markets, where volatility often surprises, developing a strong grasp of candlestick patterns equips you to make more confident and timely trading decisions. Whether trading on the Pakistan Stock Exchange (PSX), forex platforms, or digital assets like Bitcoin on local exchanges, the insight gained here can be a game changer for your portfolio.
Understanding candlestick patterns is fundamental for traders aiming to read market sentiment quickly and accurately. These patterns reveal how price action unfolds within a trading period, offering clues about potential reversals or continuations. For instance, spotting a hammer candle after a bearish trend may hint at a coming rally, helping traders decide entry points with more confidence.
Candlestick charting originated in Japan during the 18th century, thanks to a rice trader named Munehisa Homma. He developed this method to capture price movements visually, making it easier to decode market psychology beyond mere numbers. This historic approach remains relevant today as it gives traders a detailed snapshot of price behaviour within specific time frames.
Compared to line or bar charts, candlestick charts provide more nuance. Each candle encapsulates four price points: the opening, closing, high, and low during the period, making it easier to read momentum and volatility at a glance. For example, while a line chart might show only closing prices, a candlestick visualises whether buyers or sellers dominated, which is crucial for making timely decisions.
Traders rely on candlestick patterns because they condense complex market information into intuitive visual cues. Patterns such as engulfing or evening star signal shifts in supply and demand forces. When combined with volume and other technical indicators, these patterns improve the accuracy of trade setups and risk management strategies, reducing guesswork.
A single candlestick displays the open, close, high, and low prices for a trading interval. For example, in a daily chart of PSX-listed company shares, the candle shows how prices moved from market open to close. Recognising these four points allows traders to understand the day's trading range and price direction.
The candlestick body represents the price range between opening and closing. If the close is above the open, the body appears bullish, often coloured green or white. The thin lines extending from the body—called wicks or shadows—show the highest and lowest prices during that period. Long wicks reveal price rejection, signalling potential reversals or indecision.
Bullish candles indicate buying pressure, while bearish ones reflect selling dominance. For example, a long bullish candle after a downtrend suggests buyers have taken control, possibly triggering an upward move. Traders watch these signals carefully to make timely buy or sell decisions, especially in volatile markets like forex or commodities trading.
Candlestick patterns, through their clear visual signals, help traders forecast price moves and manage risks better, making them essential tools in today’s fast-moving markets.
Candlestick patterns offer traders a visual shortcut to understanding market sentiment and potential price movements. Recognising common patterns helps you anticipate trend reversals or continuations without relying solely on complex indicators. For instance, a clear reversal pattern in the Pakistani stock market or forex pairs like USD/PKR can provide timely signals that save you from losses or highlight entry opportunities.
A Doji forms when the opening and closing prices are almost the same, creating a very small body with long wicks. This pattern suggests indecision in the market — neither buyers nor sellers have full control. For example, if a Doji appears after a strong upward move, it may warn traders that bullish momentum is fading and a reversal or pause could follow. However, confirmation with the next candle or volume is essential before acting.
These look similar but appear in different contexts with contrasting meanings. A Hammer has a small body near the top, a long lower wick, and signals potential bullish reversal after a downtrend. Imagine a Pakistani company’s share price dropping steadily; spotting a Hammer on the daily chart might hint at buyers stepping in to support prices.
In contrast, a Hanging Man forms after an uptrend, with a long lower wick and small upper body. It warns that selling pressure is increasing, though confirmation is needed before exiting long positions.
An Inverted Hammer has a small body with a long upper wick, appearing after a downtrend. It signals possible bullish reversal as buyers try to push prices higher but meet resistance. For example, if a foreign exchange pair like GBP/PKR shows an Inverted Hammer during a fall, traders might watch closely for a rebound.
A Shooting Star emerges after an uptrend and looks like an inverted hammer but suggests bearish reversal. Sellers have pushed prices down after an initial rally, indicating weakening buying interest.
Engulfing patterns involve two candles where the second candle’s body fully engulfs the previous one’s body. A Bullish Engulfing pattern after a downtrend signals strong buying; a Bearish Engulfing after an uptrend suggests selling pressure. These patterns hold more weight when confirmed with volume spikes.
These three-candle patterns are reliable reversal signals. The Morning Star appears at the bottom of a downtrend: a large bearish candle, followed by a small-bodied candle indicating indecision, and a large bullish candle confirming a turnaround. This can be seen in commodities like oil futures that Pakistani traders watch.
The Evening Star is the reverse—occurring at the top of an uptrend to warn of a downturn. Spotting these early provides chances to exit before losses mount.
Harami means "pregnant" in Japanese and shows a small candle contained within the previous large candle’s body. A Bullish Harami at a downtrend suggests a slowing down of selling momentum; a Bearish Harami after an uptrend warns that buyers are losing steam.
Tweezer patterns form when two candles have nearly equal highs or lows, signalling strong support or resistance levels. For example, Tweezer Bottoms in the KSE-100 index might hint at a market floor, helping traders set stop losses sensibly.
Recognising these candlestick patterns improves your timing and decision-making, especially when combined with volume and other technical tools tailored for Pakistani markets.
Using candlestick patterns effectively helps traders spot potential market reversals or continuations. These patterns form the foundation for making informed trading choices, especially when paired with other market data. Understanding how to interpret and apply them correctly can prevent common pitfalls, such as entering too early or relying solely on candlestick shapes without confirming signals.
Volume is a key factor in validating candlestick patterns. A strong pattern supported by rising volume often indicates genuine market interest, making price action more reliable. For instance, a bullish engulfing pattern accompanied by high volume suggests a stronger chance of upward momentum. On the other hand, if volume is low during a pattern, it could mean weak conviction, signalling the need for caution.
Beyond volume, indicators like the Relative Strength Index (RSI) and moving averages complement candlestick analysis. RSI helps measure overbought or oversold conditions, adding context to a pattern. For example, spotting a hammer candle when RSI is below 30 can imply a higher probability of trend reversal. Moving averages smooth out price data, helping confirm the trend direction and filter out false signals. Combining these tools offers a clearer picture before committing to a trade.
Setting the right stop loss and take profit levels is crucial to protect your capital and lock in gains. Traders often place stop losses just below the low of a bullish reversal candle or above the high of a bearish one. For example, after spotting a shooting star pattern, a stop loss slightly above its wick helps manage risk if the market reverses unexpectedly. Take profit targets can be set based on recent support or resistance levels, or by applying a fixed risk-to-reward ratio such as 1:2.
Timing your entry is equally important. Jumping in immediately after a pattern forms may sometimes lead to false breakouts. Waiting for confirmation through a subsequent candle closing in the expected direction or observing volume spikes can improve success. This patience helps avoid chasing trades and keeps emotions in check, especially during volatile periods.
In forex trading, candlestick patterns react to high liquidity and quick news flows. Traders should consider factors like time zones and major economic announcements that may affect pattern reliability. For example, a hammer forming during low liquidity hours may not hold the same weight as one during active market sessions.
For the Pakistani stock market, patterns must be read in context with local trading hours and specific market behaviors. Pakistani equities sometimes show prolonged consolidations due to low volume compared to global markets. Recognising this helps avoid misreading pattern signals and improves timing on PSX-listed stocks.
Commodity trading, including markets like oil or gold relevant to Pakistan’s import costs, also benefits from candlestick analysis. External factors like geopolitical events or government policies significantly impact commodities, so patterns should be interpreted alongside news and fundamental analysis. For instance, a bearish engulfing candle on crude oil futures may hint at price drops but needs confirmation given volatile geopolitical risks.
Successful trading relies not just on spotting candlestick patterns but on how you integrate them with volume, indicators, and market-specific factors. Thoughtful analysis of these elements sharpens entry and exit decisions across different trading instruments.
Accessing PDF resources can be a straightforward way for traders to deepen their understanding of candlestick patterns. PDFs often provide structured, detailed content that traders can review at their own pace, which is especially helpful for beginners and those who prefer offline reading. Moreover, many PDFs include examples, charts, and step-by-step explanations that make complex candlestick concepts easier to grasp.
Official trader education websites usually offer the most accurate and updated material on candlestick patterns. These might include sites from recognised financial authorities or exchanges, and often have educational sections packed with well-researched guides. Using PDFs from such official platforms ensures that you are learning techniques grounded in sound market practices rather than hearsay or outdated methods.
Reputed financial blogs and platforms also publish useful PDFs that combine practical experience with analytical insights. These platforms often cater to active traders and include market-specific examples, which can be particularly relevant for Pakistani traders navigating local markets like the PSX or commodity exchanges. PDFs here may also include case studies and scenario analysis, offering a more hands-on perspective.
Local Pakistani resources and forums can be invaluable for contextual learning. Forums and community sites where local traders share their experiences might provide PDFs that address trading challenges relevant to Pakistan's economic and market conditions. These resources often come with examples peculiar to regional stocks, forex pairs, or commodities like cotton and sugar.
Practical exercises and examples embedded within PDFs are essential to solidify knowledge. For instance, working through chart examples with real historical data helps you recognise patterns under actual market conditions. This active engagement prevents passive reading and sharpens your pattern recognition skill.
Taking notes and building a personal pattern library from PDF materials can improve retention. Write down key patterns, their meanings, and your observations during live trading sessions. Over time, this custom reference grows into a personalised toolkit that you can easily consult before making trade decisions.
Combining PDF resources with live market analysis is crucial for applying theory to practice. Use the PDFs as a base, then watch real-time price movements on platforms supporting candlestick charts. Observing how patterns play out in live trading sharpens your ability to separate valid signals from noise.
Remember, learning candlestick patterns is not just about memorising shapes but understanding their context in the market. PDFs are a great starting point, but practical application and ongoing study are essential to trading success.
Trading candlestick patterns can be rewarding, but many traders stumble by making avoidable errors. Understanding common pitfalls helps you navigate the markets more smartly, preventing unnecessary losses and frustration. Focusing on these key mistakes ensures your trading decisions are better informed and grounded.
One typical mistake is trusting candlestick patterns alone without considering wider market trends. For example, a bullish engulfing pattern may suggest a price rise, but if the overall market is in a strong downtrend, that signal might fail. Ignoring context results in false signals, leading traders to enter positions just before prices reverse harshly.
In Pakistan's volatile stock market, keeping an eye on the KSE-100 index trend alongside candlestick patterns offers extra confirmation. If the index is constantly trading lower, it's sensible to be wary of bullish patterns on single stocks. Consider combining candlestick analysis with trend indicators like moving averages to avoid getting trapped by misleading short-term signals.
Another frequent issue is misunderstanding what a pattern truly signals. For instance, a Doji candle indicates indecision, but some inexperienced traders might see it as a buy or sell signal without waiting for confirmation. Without recognising nuances, traders might enter too early or assume a reversal that does not develop.
Moreover, candlestick shapes vary by timeframes. A hammer on a 5-minute chart carries different weight than one on a daily chart. Misreading this can lead to mistimed trades. Traders should apply patterns to timeframes suitable for their trading style and confirm with volume or other indicators to avoid misinterpretation.
Skipping proper stop loss placement is a costly mistake. Many traders spot a strong candlestick pattern but fail to define their exit if the trade goes wrong. Without stop losses, small losses can snowball into significant damage to your trading capital.
For example, if you buy after a morning star pattern without a stop loss just below the pattern’s low, a sudden market dip can wipe out your gains quickly. Evaluating support and resistance levels to set stops gives you a safety net and maintains discipline in volatile markets.
Emotions often take over when traders lose money. They might compulsively jump into new trades immediately, seeking to recover losses quickly. This "chasing" behaviour invites poor decision-making and increases risk exposure.
In Pakistan’s sometimes choppy forex market, chasing trades can be especially dangerous. Instead of rushing after a loss, it’s better to step back, review your strategy, and wait for a clean candlestick signal within a stable market environment. Discipline and patience protect you from compounding losses.
Mastering candlestick patterns means not just spotting signs but also preventing common errors. Stay aware of the market context, interpret patterns carefully, and manage risk prudently to improve your trading outcomes.
Integrating candlestick patterns with modern trading tools helps traders make more informed decisions. These tools provide real-time data, advanced charting, and automation, allowing precise identification and execution based on candlestick signals. For Pakistani traders, combining traditional chart reading with technology offers an edge in volatile markets like PSX and Forex.
Apps offered by the Pakistan Stock Exchange (PSX) provide built-in technical analysis tools that support candlestick pattern recognition. These features include zoomable candlestick charts, indicators like moving averages and RSI, and alerts set for specific patterns such as engulfing or hammer candles. Traders can monitor stocks like HBL or Engro Chemicals on the go, spotting setup opportunities without delay.
Such functionalities make it easier for investors to blend candlestick analysis with supportive data, improving entry and exit timing in Pakistan’s dynamic stock market. Beyond desktop, these apps sync with online accounts, ensuring traders don’t miss signals while commuting or during loadshedding hours.
Mobile trading apps like JazzCash Markets or Bykea’s trading extensions deliver responsive charting tools designed for smartphones. Visual clarity under varying light conditions, smooth pinch-to-zoom for candlestick details, and quick pattern recognition help traders react swiftly even amid daily distractions.
The importance lies in accessibility; you aren’t tied to a desktop to study candlestick formations or verify signals. This flexibility suits retail investors juggling multiple responsibilities or those scouting for quick scalp trades in Pakistan’s forex or commodities markets.
Algorithmic trading systems scan thousands of price movements to detect candlestick patterns instantly. These algorithms use programmed rules to identify exact formation criteria—like body size and wick length—much faster than manual analysis. For example, a bot might flag an evening star pattern forming on local PSX stocks or Forex pairs like USD/PKR, triggering entry signals.
This automation reduces human error and emotional bias in pattern trading. It also favours high-frequency traders utilising pattern recognition to capitalise on short-term price fluctuations that manual traders may miss.
Automated systems integrate risk management rules directly into trading algorithms. Stop losses and position-sizing are pre-set to restrict unexpected losses should a candlestick pattern fail to produce the expected move. For Pakistani traders, this feature helps manage volatile periods affected by economic announcements or geopolitical events.
Moreover, automated alerts notify traders immediately if the system detects irregular market behaviour or higher risk levels, enabling timely manual intervention. This layered risk control adds a safety net absent in purely manual trading relying on candlestick patterns alone.
Blending traditional candlestick pattern knowledge with modern trading tools strengthens your strategy, offering real-time insight, faster decision-making, and built-in safeguards essential for successful trading in Pakistan’s markets.
📈 Master advanced candlestick patterns in trading! Learn complex signals, risk management, and how to combine candlestick analysis for smarter market moves in Pakistan.
📈 Learn how to read and use candlestick patterns in forex trading effectively. Understand key patterns, avoid common mistakes, and sharpen your trading strategy.
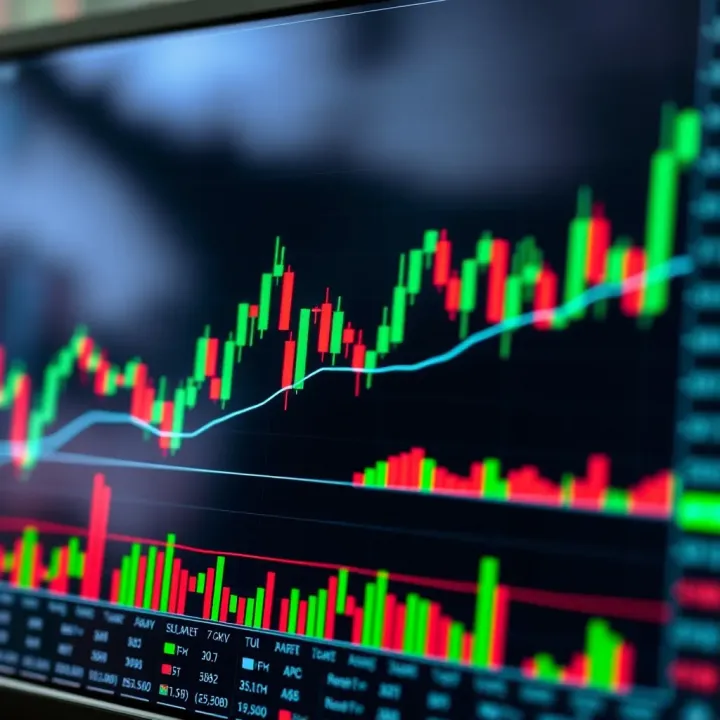
Master candlestick patterns 🕯️ in trading! Learn how single, double & triple formations guide smarter market moves & boost your investing skills 📈.
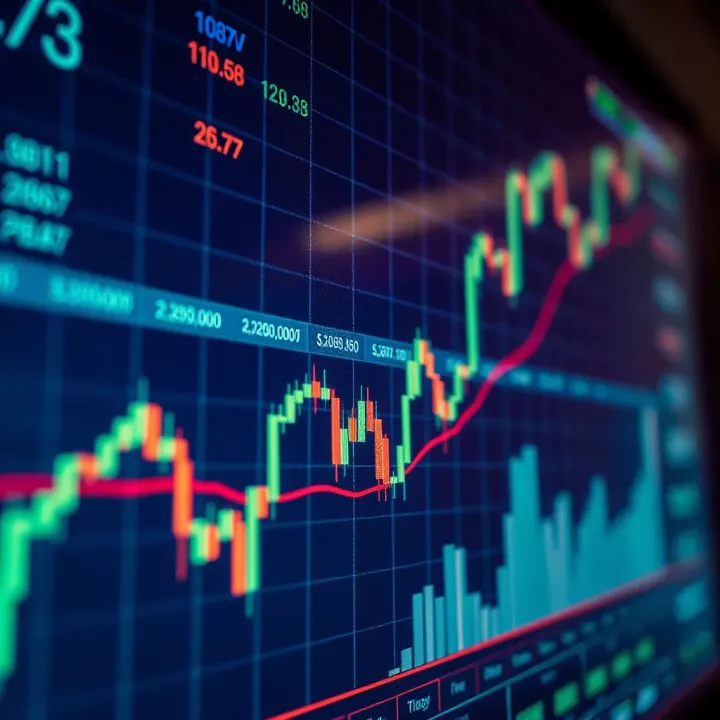
Learn forex trading in Pakistan 🇵🇰 with clear steps, local rules, safe tips, and best platforms. Understand market basics and risks to trade confidently.
Based on 6 reviews