

Bearish Candlestick Patterns Explained
📉 Learn how bearish candlestick patterns warn of price drops in trading. Discover key signs, confirmation tactics, and smart risk management strategies.
Edited By
Isabella King
Candlestick patterns are among the most widely used tools in technical trading, especially in markets like Pakistan’s equity and crypto exchanges where timing entry and exit points is crucial. These patterns visually represent price movements on a chart, helping traders gauge market sentiment and possible trend reversals.
At their core, candlestick patterns show the open, close, high, and low prices within a specific time frame. A bullish candlestick pattern indicates strong buying pressure, suggesting prices may continue to rise. Conversely, a bearish candlestick pattern typically signals selling pressure, hinting at a potential price drop.

Understanding these patterns can prevent costly mistakes from reacting only to price swings without context. For example, the bullish engulfing pattern forms when a small bearish candle is followed by a larger bullish candle that 'engulfs' it. This indicates a shift from sellers to buyers, often preceding an upward move.
On the other hand, the bearish engulfing pattern occurs when a small bullish candle is overtaken by a larger bearish candle, signalling sellers might be taking control. Recognising such signals early can improve trade timing and risk management.
Candlestick patterns reflect trader psychology — fear, greed, hesitation — giving insight beyond numbers alone.
Practical use of these patterns involves confirming them with other technical indicators such as volume, moving averages, or RSI (Relative Strength Index). For instance, spotting a bullish pattern near a support level with rising volume adds confidence in a buy decision.
Many traders combine candlestick analysis with market context — like overall trend direction, economic news from the State Bank of Pakistan (SBP) or relevant corporate announcements — to avoid false signals.
In short, mastering bullish and bearish candlestick patterns equips traders with an edge in predicting market moves, improving decision-making on platforms like PSX or crypto exchanges. This article will explore the most common patterns, their formation, and how you can apply them smartly for better trading results in the Pakistani markets.
Candlestick patterns act as a practical tool for traders and investors to gauge market sentiment quickly. These patterns summarise price movements within a specific time frame, highlighting the psychological tug of war between buyers and sellers. Understanding these basics helps in anticipating possible market moves, which is especially useful when making decisions amid volatility in markets like the Pakistan Stock Exchange (PSX) or Karachi's active forex boards.
Candlestick charts originated in Japan in the 18th century, initially used by rice traders. Each candlestick displays four key prices: the opening, closing, highest, and lowest within the chosen period—be it minutes, hours, or days. The “body” shows the distance between opening and closing prices, while the “wicks” (or shadows) represent highs and lows. This compact visual gives traders a snapshot of price pressure.
A bullish candle forms when the closing price is higher than the opening price, signalling buyers had the upper hand. Conversely, a bearish candle closes below the opening, showing sellers dominated. In Pakistan’s currency or stock markets, recognising this difference matters because sequences of bullish candles often hint at uptrends, while bearish ones can warn of declining momentum.
The size and shape of a candlestick can reveal price action nuances. For example, a long body with short wicks suggests strong buying or selling pressure, while a small body with long wicks indicates indecision among traders. Observing these subtle shifts helps in spotting potential reversals or continuation of trends, a practice common among day traders following Pakistani market sessions.
Markets move as buyers and sellers compete, and candles visually capture this interaction. When buyers push prices higher, bullish candles appear; when sellers outweigh buyers, bearish candles emerge. This dynamic reflects the constant balancing act in trading, whether it’s in a high-volume stock like OGDC or commodity futures.
Fear and greed strongly influence every price shift. A sudden bullish candle after a string of bearish ones may reflect fear turning into hope. Likewise, a bearish engulfing pattern might indicate panic selling. By learning to read these emotional hints within candlesticks, traders can better anticipate market sentiment shifts and adjust their strategies accordingly.
Candlestick patterns act like a language conveying trader decisions. For example, a hammer pattern often appears after a downtrend, signalling buyers stepping in to reverse the fall. In Pakistan’s markets, recognising such patterns has helped many avoid losses during volatile periods caused by political changes or external shocks.
Understanding candlestick basics provides a foundation to interpret market sentiment effectively, improving your chances to spot profitable trades or avoid potential pitfalls.
By mastering the core structure of candlesticks and the psychology behind them, you lay the groundwork for trading more confidently and strategically in Pakistan’s fast-moving financial markets.
Bullish candlestick patterns signal potential rises in price and help traders identify turning points in the market. They provide actionable clues about when buyers might be gaining control, which is crucial for timing entry and exit. Recognising these patterns enables traders to anticipate market moves rather than react blindly, improving decision-making particularly in markets like the Pakistan Stock Exchange (PSX) or crypto trading.
Hammer and Inverted Hammer: The hammer appears during a downtrend with a long lower wick and a small body near the top, showing that sellers pushed price down but buyers managed to drive it back up before closing. An inverted hammer has a long upper wick but a small real body at the bottom, also indicating buying pressure. Both patterns suggest a potential reversal but need confirmation from the next candle or volume.

Bullish Marubozu: This candle has no shadows and a full body, indicating strong buying throughout the session. It reflects clear buyer dominance and often marks the start of an uptrend. For instance, after a series of small candles with indecision, a bullish Marubozu in a PSX stock chart can hint at strong momentum.
Bullish Engulfing Pattern: This occurs when a small bearish candle is followed by a larger bullish candle that fully engulfs the previous one. It points to a sudden shift in sentiment towards buyers. This pattern is particularly helpful during downtrends, showing that bulls are taking charge.
Piercing Line: After a downtrend, a bearish candle is followed by a bullish one that opens lower but closes above the midpoint of the previous candle. This signals buyer strength returning mid-session and often precedes a reversal.
Morning Star: A three-candle pattern where a long bearish candle is followed by a small-bodied candle (indecision), then a strong bullish candle that closes well into the first candle’s body. It's a reliable reversal signal, especially when combined with support zones.
Context within trend: Bullish patterns gain weight when they appear after a clear downtrend or near established support levels. If seen in an existing uptrend, their reversal significance lowers.
Volume confirmation: Volume rising during bullish pattern formation strengthens the reliability. For example, a bullish engulfing candle appearing on high volume in a PSX stock suggests genuine buying interest, not just a one-off spike.
Combining with support levels: When bullish patterns occur near historically tested support levels, the chance of a true reversal increases. This combination acts as a higher probability setup for traders to enter long positions.
Recognising these patterns in real-time can save traders from costly wrong decisions and help catch profitable moves early. Combining pattern signals with volume and support analysis enhances trading accuracy significantly.
Recognising prominent bearish candlestick patterns helps traders anticipate downward price movements. These patterns signal sellers gaining control, indicating potential trend reversals or continuation of a bearish move. For anyone trading in the Pakistan Stock Exchange (PSX) or crypto markets, understanding these patterns can improve entry and exit decisions, especially during volatile market phases.
Shooting Star: The shooting star is a candle with a small real body near the low of the session and a long upper wick. It typically appears after an uptrend and suggests that buyers tried to push the price higher but lost momentum by the close. This pattern hints at selling pressure catching up, making it a useful warning for traders to consider tightening stops or preparing for a possible pullback.
Bearish Marubozu: A bearish Marubozu has no upper or lower wick, representing strong selling throughout the session. Its long solid body reflects aggressive selling from open to close. This pattern is a clear sign that bears are firmly in control, often preceding further downward movement. For example, a Marubozu on a major PSX stock like OGDC might warn traders to exit longs or consider short positions.
Bearish Engulfing Pattern: This pattern occurs when a small bullish candle is followed by a larger bearish candle that completely engulfs it. It signals a shift in momentum from buyers to sellers. On daily charts, spotting a bearish engulfing pattern near resistance areas gives traders a clear heads-up about a possible downtrend starting.
Evening Star: The evening star is a three-candle formation indicating a potential top. It begins with a strong bullish candle, followed by a small-bodied candle (star) that gaps above the first, and then a bearish candle that closes well into the first candle's body. This pattern shows hesitation by buyers before sellers step in decisively.
Dark Cloud Cover: This pattern forms when a bearish candle opens above the previous bullish candle's close but closes below its midpoint. It suggests that the upward rally is weakening as sellers push prices down quickly within the session. The dark cloud cover often acts as an early warning for a trending market losing steam.
Role in identifying resistance levels: Bearish patterns tend to cluster near resistance zones, confirming the strength of those levels. Recognising these patterns enables traders to validate resistance and avoid entering new long positions prematurely.
Volume changes during pattern formation: Volume often spikes when bearish patterns form, highlighting increased selling interest. A bearish engulfing candle with above-average volume is more reliable than one with low volume, emphasizing stronger conviction by sellers.
Watch for confirmation signals: No pattern guarantees reversal alone. Traders should seek confirmation through follow-up candles, indicator weaknesses (like a falling RSI), or breaks of trend lines. Combining bearish candlestick patterns with these signals reduces false alarms and improves trade timing.
Spotting these bearish candlestick patterns early helps traders protect profits and enter short positions with better timing, essential skills in dynamic markets like PSX or crypto.
In summary, mastering bearish candlestick patterns empowers traders to read market sentiment, spot reversals, and adjust strategies accordingly. Practical use of these patterns with volume and confirmation adds confidence to trading decisions, particularly in fluctuating Pakistani markets.
Candlestick patterns offer practical clues about likely price moves, but they work best when integrated into a broader trading toolkit. Using these patterns effectively involves combining them with other technical tools, managing risks with clear rules, and avoiding common pitfalls. This approach helps traders, especially those operating in volatile markets like Pakistan's stock exchange or crypto platforms, make more informed decisions.
Combining candlestick patterns with trend lines and moving averages can significantly improve trading accuracy. For instance, spotting a bullish engulfing pattern near a rising 50-day moving average can signal a solid buying opportunity. Trend lines help identify the prevailing market direction; a pattern that supports the trend often has more weight than one appearing against it. This way, you avoid chasing false signals and stick to moves aligned with market momentum.
Using candlestick patterns alongside indicators like the Relative Strength Index (RSI) and Moving Average Convergence Divergence (MACD) adds confirmation before entering trades. For example, a bearish evening star pattern near an RSI reading above 70 (overbought) strengthens the chance of a reversal. MACD crossovers matching a bullish morning star pattern also provide a more reliable buy signal. These layered confirmations help reduce mistakes and boost confidence in trade setups.
Setting stop-loss orders around key candlestick levels limits losses if the pattern fails. For example, after entering a trade on a hammer pattern, placing a stop-loss just below its low protects capital if the price dips further. This small buffer avoids getting knocked out by normal price fluctuations while capping potential damage from incorrect signals.
Trade size and position allocation are just as important. Never risk more than a small percentage of your trading capital on a single pattern-based trade. For example, allocating 1-2% of your account on each setup lets you survive a string of losing trades without significant damage. Position sizing should also reflect pattern reliability and market volatility. In Pakistani markets, where sudden swings can occur due to news or external factors, careful position sizing keeps the portfolio safe.
A frequent error is misreading patterns out of context. For instance, spotting a morning star in a strong downtrend without other supportive signals can lead to premature buying. Always consider trends and levels around the pattern. Without this context, false reversals can trap traders.
Ignoring volume and confirmation weakens the reliability of candlestick signals. Volume spikes alongside bullish or bearish patterns confirm trader interest and strengthen the signal. In the absence of volume support, patterns often fail. For example, a bullish engulfing without increased volume on Karachi Stock Exchange may be less trustworthy.
Over-reliance on single indicators or patterns is risky. Relying solely on one pattern or just RSI readings can mislead traders. Instead, use multiple confirmations including moving averages, volume analysis, and support/resistance levels. Combining these tools balances strengths and weaknesses, leading to better outcomes.
Using candlestick patterns wisely means studying the bigger picture, managing risks clearly, and avoiding shortcuts. This approach serves traders of all levels, especially in challenging market conditions like those faced in Pakistan today.
Practical examples and chart analysis form the backbone of understanding candlestick patterns in real trading scenarios. Chart analysis helps traders to connect theory with market behaviour, particularly in volatile markets like Pakistan's. These examples reveal how bullish and bearish patterns actually unfold on charts of local stocks or indices, which is vital for making informed trading decisions.
Applying real examples from Pakistan Stock Exchange (PSX) refines your ability to spot entry and exit points. For instance, seeing a bullish engulfing pattern followed by volume increase in a PSX stock gives a concrete signal rather than just theoretical knowledge. This grounded approach improves confidence and discipline in trading.
Several PSX-listed companies have displayed clear bullish reversal patterns such as the Morning Star or Bullish Engulfing during market corrections. For example, a banking sector stock suddenly forms a Hammer pattern accompanied by rising volume, signalling buyers stepping in. Traders using these signals wisely can secure good entries before the uptrend gains momentum.
Analyzing such case studies illustrates how local market sentiment reacts to economic news or policy changes. This localised insight is a practical advantage over generic pattern identification, helping you adjust strategies specific to sectors showing strength.
Daily charts provide fine-grained insight into short-term market moves, suitable for active traders or swing trading. Weekly charts smooth out noise, revealing longer-term trends where patterns like the Morning Star carry more weight. Understanding the difference helps in timing trades better.
In Pakistani markets, weekly charts often highlight fundamental shifts, such as improved corporate earnings or favourable SBP monetary policies, that daily charts might miss. Combining both timeframes allows a better risk-reward assessment.
Bearish patterns like the Shooting Star or Evening Star often appear around resistance levels during volatile phases, such as before elections or economic turbulence in Pakistan. Recognising these helps you avoid late entries or set protective stops before downturns.
For example, in a volatile session, spotting a Bearish Engulfing with higher than normal volume can warn of strong selling pressure. Reacting early limits loss and preserves capital.
When bearish signals confirm a downtrend, adjusting your approach is key. This might mean reducing position size, switching to short-term trades, or even hedging using futures or options.
Successful traders in Pakistan often combine candlestick signals with support/resistance analysis and market news. This multi-layered approach prepares them for prolonged declines, such as those caused by currency devaluation or rising inflation.
Platforms like TradingView, MetaTrader, and local brokerage tools offer access to PSX data with comprehensive candlestick charts. TradingView, in particular, is favoured for its user-friendly interface and real-time analysis tools.
Choosing a platform familiar with Pakistani market timing and incorporating local indices ensures timely decisions. Access to intraday data adds value for active traders.
Automatic pattern recognition indicators, volume overlays, and multi-timeframe analysis are key features. These help confirm signals and reduce misinterpretation.
For instance, volume confirmation tools paired with RSI or MACD indicators strengthen pattern signals. Alerts for specific candlestick formations help busy traders monitor multiple stocks without constant screen-watching.
Combining practical examples with reliable charting tools bridges the gap between theory and action, making trading more precise and adaptive to local conditions.
📉 Learn how bearish candlestick patterns warn of price drops in trading. Discover key signs, confirmation tactics, and smart risk management strategies.

Master candlestick patterns 🕯️ in trading! Learn how single, double & triple formations guide smarter market moves & boost your investing skills 📈.
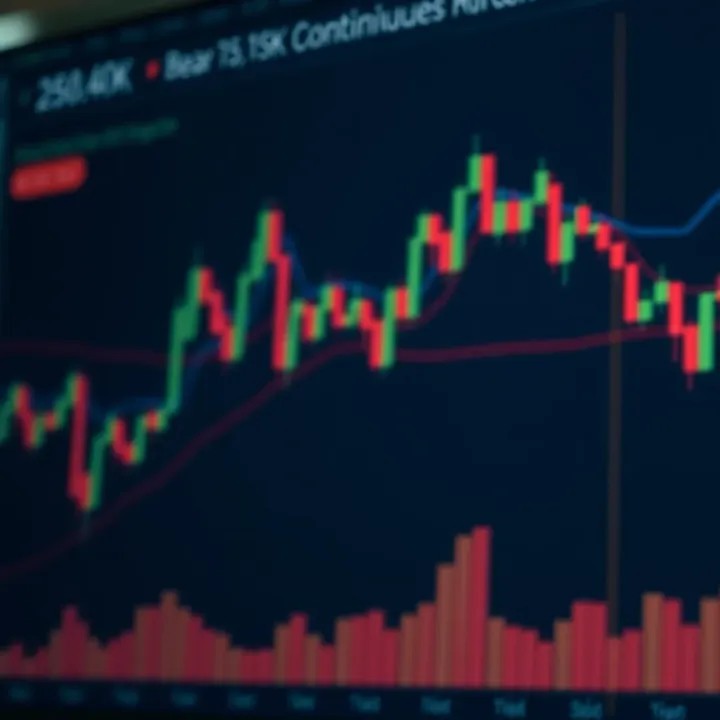
📉 Learn how to spot bearish chart patterns in trading, understand what they mean for price drops, and apply smart risk management to protect your investments.

📈 Master advanced candlestick patterns in trading! Learn complex signals, risk management, and how to combine candlestick analysis for smarter market moves in Pakistan.
Based on 12 reviews