

Complete Guide to Reading Candlestick Patterns
Master candlestick patterns 🕯️ in trading! Learn how single, double & triple formations guide smarter market moves & boost your investing skills 📈.
Edited By
Daniel Hughes
Grasping bearish candlestick patterns is a handy skill in trading, especially in markets like stocks, crypto, and forex. These patterns offer clues about when prices may take a tumble, giving traders a chance to act smartly before losses pile up.
In this article, we'll break down the key bearish candlestick patterns—what they look like, what they mean, and how you can spot them in real-time charts. We'll also touch on how to back up these signals with other tools and manage risks to protect your capital.

Whether you’re a stockbroker watching market swings or a crypto enthusiast trying to outsmart price drops, understanding these candlestick signals adds a solid layer to your trading toolkit. It’s not just about spotting a red candle; it’s about reading the story the market’s telling you.
Bearish candlestick patterns don’t guarantee a drop, but if you learn to spot them early, you can better prepare for what's coming and minimize surprises.
Let’s dive in, unpack the patterns, and give you a clearer edge in reading the market’s downward moves.
Bearish candlestick patterns are like warning signs in the world of trading. They help traders spot when prices might turn downwards, giving a heads-up to either sell off or avoid buying at a peak. These patterns are not just shapes on a chart; they tell a story about market psychology and shifts between buyers and sellers. Understanding them can give anyone, from crypto traders in Karachi to investors in Lahore’s stock market, an extra edge.
When you see a bearish candlestick pattern forming, it's essentially a signal that sellers are starting to have the upper hand. This can be invaluable because it helps prevent losses or catch the start of a downward trend. For example, spotting a bearish engulfing pattern after a rally could mean prices are about to drop, so a trader might decide to exit a position or tighten stop losses.
A candlestick in trading charts is like a mini-report of price action over a certain period — it shows where the price opened, closed, and how far it moved in between. Each candlestick has a body and wicks (or shadows) at the top and bottom. When the close price is lower than the open, the candlestick typically appears shaded or red, signaling selling pressure.
The size and shape of these candlesticks give clues about market sentiment. For instance, a long red (bearish) candlestick suggests heavy selling and potential further declines, while a small body might mean indecision.
By analyzing sequences of these candlesticks, traders learn about shifts in momentum. Candlestick patterns that hint at bearish trends show when sellers gain confidence, often leading to price drops.
Bearish candlestick patterns matter because they help traders avoid getting caught on the wrong side of the market. Knowing when a rally might be ending allows a trader to safeguard profits or to prepare to enter short positions.
For example, ignoring bearish signals in a volatile market like Pakistan Stock Exchange (PSX) could lead to heavy losses. Traders who spot patterns like the “Dark Cloud Cover” or “Evening Star” early get a better shot at timing their moves right.
Moreover, these patterns work best when used alongside other tools, making trading more than just guesswork. They improve decision-making by giving a visual clue backed by historical price action.
Bearish sentiment basically means traders and investors expect prices to fall. When this mood takes hold, sell orders pile up, driving prices down. Bearish candlestick patterns reveal this shift by showing that sellers are becoming more aggressive than buyers.
For example, after a long uptrend, if a trader spots a “Shooting Star” candlestick, it signals that the buyers tried to push prices higher but failed. The sellers stepped in strong, pushing prices back down by the close of the period. This tug of war visible in the candle is a clear sign of a possible reversal.
Market sentiment isn’t static. Buyers might dominate at one point and then sellers take charge, which often triggers change in price direction. Bearish candlestick patterns capture these turning points.
Imagine a day when buyers confidently push prices up early, but by the end, sellers overwhelm them and prices close much lower. This shift is often reflected in patterns like the “Hanging Man.” It tells traders the balance is tipping toward selling pressure, sometimes catching even experienced traders by surprise.
Remember, a single bearish candlestick pattern alone doesn’t panic sell; it’s a sign to watch closely and look for confirmations from volume or other technical indicators.
By paying attention to these behavioral shifts in the market, a trader can better anticipate when a trend might lose steam and react accordingly.
Recognizing key bearish candlestick patterns can give traders a real edge when spotting potential downtrends. These patterns aren’t just random shapes; they reflect shifts in market sentiment and can hint that sellers are gaining the upper hand. If you’re trading stocks, forex, commodities, or crypto, getting familiar with patterns like the Bearish Engulfing or the Shooting Star adds valuable signals to your toolkit.
Understanding these patterns helps in timing entries and exits better, cutting losses early, and avoiding getting caught in false moves. Let’s break down some of the main bearish patterns you’ll want to spot.
The Bearish Engulfing pattern shows up when a small green (or white) candle is followed by a large red (or black) candle that completely covers or "engulfs" the body of the previous candle. This means the sellers overwhelmed the buyers decisively in that session. Imagine you’re watching the KSE-100 index chart; one day there’s a modest uptick, then the next day, a big sell-off swamps the gains.
This pattern is a strong hint of a potential downward move, especially after an uptrend. It suggests sellers have taken control with conviction, and prices may slide further. Traders often look for confirmation from volume — if the engulfing candle has higher trading volume, it’s a more reliable signal to short or sell.
The Dark Cloud Cover appears when a bullish candle is followed by a bearish candle opening above the prior day’s high but closing deep into the previous candle’s body — at least halfway down. It’s like the price tried to push higher but was met with strong resistance and reversed sharply.
This pattern signals a loss of upward momentum and possible reversal from a bullish trend to a bearish one. Spotting this pattern near resistance levels or after a significant rally can save traders from holding long positions into a downturn. For instance, on Pakistan’s PSX, if oil stocks form this pattern after a spike, it might hint at a coming correction.
The Evening Star is a three-candle pattern: first, a big bullish candle; second, a small-bodied candle that gaps above the first; third, a large bearish candle that closes well into the first candle’s body. The tiny middle candle shows indecision or a pause before the sellers jump in.
This pattern is a classic reversal signal, indicating that the prior upward trend is fading and bears are stepping in. It often appears at the top of an uptrend and can warn traders to tighten stops or prepare for short positions.
The Hanging Man has a small real body near the top of its range, little or no upper shadow, and a long lower shadow—like a lollipop dangling. Though it looks like an inverted hammer, it only carries bearish significance after an uptrend.
Seeing a Hanging Man tells traders to be alert. It means buyers pushed prices up but couldn’t sustain those levels as sellers pushed back hard during the session. Confirmation on the next candle’s move is essential before acting, as it’s easy to misinterpret this pattern.
The Shooting Star has a small real body near the lower price range for the day, and a long upper shadow that’s at least twice the size of the body. This shows the bulls tried to drive prices higher but failed, with bears pushing prices back down toward the close.
This pattern often appears after a price advance and suggests a possible top or resistance rejection. Traders see it as a warning sign of selling pressure increasing, so it’s a prompt to consider exiting long trades or prepare for a down leg.
Bearish candlestick patterns aren't foolproof but serve as early warning signs. When used alongside volume data and other indicators, they become powerful tools to anticipate market turns.

Understanding these patterns in real-time can give Pakistani traders a better grasp on when to hold, fold, or fortify their positions. Keep a sharp eye for these signals during your daily chart reviews.
Bearish candlestick patterns don’t carry the same weight everywhere on the charts. Their usefulness depends a lot on where they appear in the market's bigger picture. Recognizing when and where these patterns show up helps traders avoid false alarms and take smarter moves.
When the market’s been climbing steadily, a strong bearish candlestick pattern can be like a red flag waving. It signals the trend might be losing steam and could soon reverse. For example, spotting a Bearish Engulfing pattern after a bullish run often indicates buyers are tiring, and sellers are stepping in. This shift isn’t a guarantee to sell immediately but serves as an early warning. Traders often pay close attention here, getting ready to adjust their positions or take profits.
Patterns alone don’t tell the full story. Volume plays a big role. If a bearish candlestick is backed by heavy trading volume, it points to genuine selling pressure rather than just a bit of profit-taking from day traders. Also, using tools like the Relative Strength Index (RSI) can help. An RSI above 70 coupled with a bearish pattern suggests an overbought market that’s ready to pull back. Moving averages act as additional checkpoints; a bearish pattern near a key moving average crossing adds more confidence to the reversal signal.
When price has been bouncing within a narrow range without clear direction, bearish patterns become trickier to read. The market's indecisiveness means these signals often get tangled with noise. A Shooting Star in a sideways market, for instance, might just mark a temporary pause rather than pointing to a trend shift. Traders relying solely on candlesticks here might jump the gun and face whipsaws.
In such choppy markets, it’s wise to look for extra signs before acting on bearish candlesticks. Combining patterns with support and resistance levels helps; a bearish pattern forming near a known resistance zone is more telling. Volume changes, oscillators like RSI or MACD divergence, and the overall market sentiment should all line up to strengthen conviction. Without this, it's easy to get caught on the wrong side of a small, erratic price move.
Interpreting bearish candlestick patterns depends heavily on context. Recognizing the market's broader behavior and confirming signals with volume and technical indicators can spell the difference between losing money and protecting capital.
Understanding how bearish patterns behave in different market environments empowers traders with better timing and decision-making, reducing guesswork in a field where every tick counts.
Bearish candlestick patterns on their own can signal potential shifts from bullish to bearish trends, but relying solely on them can lead to false alarms. Integrating these patterns with other analysis tools enhances their reliability and helps traders make better decisions. For example, spotting a Bearish Engulfing pattern right at a significant resistance level or when the RSI indicates overbought conditions adds weight to the bearish signal. This combination approach is vital to avoid entering trades just based on a single signal, which might be misleading.
Support and resistance levels act like invisible walls that price tends to respect. When a bearish pattern forms close to a known resistance point, it suggests sellers are stepping in to push prices down. For instance, if a Shooting Star pattern appears near a resistance level established over the past weeks, it’s a stronger hint that the upward momentum might be faltering. Without this context, the pattern might be less trustworthy, as prices could bounce back easily if no key level is nearby.
Combining bearish candlestick signals with support and resistance helps fine-tune when to jump into or out of trades. Say you identify an Evening Star pattern signaling a possible drop near resistance; entering a short position then can reduce risk since you’re aligning with market structure. Similarly, if the price is heading towards a known support zone, it might be wiser to take profits or tighten stops, anticipating a possible pause or reversal. This approach helps traders avoid chasing moves and getting caught on the wrong side.
The RSI adds a layer of insight by showing whether a market is overbought or oversold. A bearish candlestick pattern appearing when RSI values are above 70 (overbought) is a stronger sell signal since the market might be due for a correction. For example, combining a Dark Cloud Cover pattern with an RSI above 70 after a steady uptrend can hint at a genuine shift in momentum, making the trading decision clearer.
Moving averages smooth out price action to reveal trends. When bearish candlestick patterns emerge below a rising moving average or the price breaks below a moving average after such a pattern, it backs up the likelihood of a downward move. Consider a Hanging Man pattern followed by a price drop below the 50-day moving average—this convergence is often a red flag for trend change. Using moving averages as dynamic support or resistance also allows better timing for placing stops or targets.
Volume is a silent but crucial factor. A bearish pattern accompanied by higher-than-average volume signals real conviction among sellers, making the pattern more trustworthy. Without volume confirmation, a pattern might just be noise. For example, a Bearish Engulfing pattern with light volume can be shrugged off, but if volume spikes, it often means serious selling pressure is underway. Monitoring volume alongside candlestick patterns helps avoid traps and spot genuine trend changes.
When you mix bearish candlestick patterns with support and resistance levels, technical indicators like RSI and moving averages, plus volume data, you build a toolkit that dramatically improves your trading edge. Each tool acts as a checkpoint, filtering out weak signals and highlighting stronger ones for smarter trades.
Overall, integrating these tools allows traders, especially in volatile markets like those in Pakistan, to navigate with more confidence and precision, managing risks smartly and spotting opportunities that might otherwise be missed.
Understanding common pitfalls in using bearish candlestick patterns is essential for any trader hoping to avoid costly errors. These patterns can point to potential price drops, but misapplying them can quickly lead to false signals and missed opportunities. A core mistake is relying solely on the candlestick pattern without looking at the bigger picture or other confirming signals. Taking these patterns at face value can result in premature trades that fizzle out, bleeding your account dry.
Bearish patterns don't exist in isolation; ignoring market context or confirmation tools often distorts their meaning. For example, a bearish engulfing might look promising but fail miserably if the overall market trend is still strongly bullish. Mistakes like these highlight why combining candlestick analysis with other tools and understanding the recent market environment pays off handsomely.
Candlestick patterns can throw off traders with false alarms, especially in choppy or low-volume markets. Picture a Shooting Star that seems perfect on the chart but happens during a midday lull with little trading activity—it might evaporate by the next candle. Without additional support, such as volume spikes or RSI divergence, these patterns risk leading you into losing positions.
Traders often jump the gun, selling just because a bearish pattern popped up, only to see the price bounce back quickly. This whipsaw effect is common when signals aren’t confirmed. It shows that relying too heavily on pattern appearances alone is a bit like setting off fireworks indoors—there’s noise but no clear result.
Confirmation acts like a safety net. It filters out weak signals and boosts your confidence that the market actually agrees with the bearish indication. For instance, a Bearish Engulfing pattern followed by increasing sell volume confirms that sellers are stepping in forcefully rather than just a random blip.
Technical indicators such as the Relative Strength Index (RSI) can also help. If the RSI is overbought and then a bearish pattern emerges, it amplifies the chance of a genuine reversal. Confirmation tools give you a clearer exit or entry signal, making your strategy more robust and less prone to gut-call losses.
Remember, a single candle rarely tells the whole story. Back it up with indicators or price action confirmation before acting.
Taking bearish patterns at face value without considering the wider market setting can be a recipe for unreliable trades. A Hanging Man in the middle of a raging bull market, for instance, might just be a hiccup rather than a reversal. The context—whether the market is trending strongly, sideways, or volatile—can make or break the pattern’s predictive power.
Ignoring this means chances are you’ll either miss out on good trades by doubting the pattern or get trapped in fakeouts by trusting it blindly. A bearish pattern at resistance or after a long uptrend tends to hold more weight than the same pattern in random price fluctuations.
Broad market trends serve as a backdrop that colors the meaning of candlestick patterns. Always ask yourself: Is the market in an overall uptrend, downtrend, or stuck in a range? Patterns that align with these contexts get a green light; contradictory patterns demand skepticism.
For instance, in Pakistan's stock market, major indices like the KSE-100 showing steady gains mean bearish signals should be treated carefully. Conversely, during a correction phase, these patterns become more reliable.
Balancing candlestick patterns with trend analysis lets traders choose moments with better risk-reward profiles. It’s a subtle skill but crucial for avoiding losses and spotting real opportunities.
By staying cautious about confirmation and market context, Pakistani traders and others alike can better interpret bearish candlestick patterns without falling into these common traps. It’s a classic case of seeing the whole forest before jumping at the sight of one suspicious tree.
Risk management is the backbone of trading, especially when dealing with bearish candlestick patterns that suggest potential downward moves. These patterns can be powerful, but without proper risk controls, they might lead you to a bigger loss than anticipated. Managing risk smartly means you can stay in the game longer and handle the unexpected twists in the market.
For example, spotting a bearish engulfing pattern might hint at a price drop, but that drop won’t always happen immediately or fully. Protective measures ensure you don't get wiped out if the market suddenly jumps back up. In volatile markets like Pakistan’s KSE 100 index, where sudden swings are common, risk management helps balance the chance of profit with the inevitable uncertainty.
Setting stop losses around bearish candlestick patterns isn’t just guesswork—it should be strategic. Typically, you place the stop loss slightly above the high of the bearish pattern. Take a typical Shooting Star pattern, for example. Its upper wick represents the highest price point that sellers rejected strongly. Setting your stop loss just above this wick provides a natural boundary: if the price moves above it, the pattern’s bearish signal is likely invalidated.
This technique keeps you tethered to the logic of the chart, rather than random price points. It helps reduce emotional decision-making, allowing you to stick to your plan. For instance, if you enter a short position after spotting a dark cloud cover pattern, placing your stop loss just above that day's high keeps your risk defined.
Markets often behave unpredictably. Even with a solid bearish signal, sudden spikes can wipe out positions if stop losses aren't judiciously set. Proper stop loss placement serves as a safety net, protecting your capital from wild reversals.
For example, during unexpected economic news releases, prices can briefly surge contrary to bearish patterns. Without a stop loss, your loss can snowball. So imagine trading crude oil futures in Pakistan: if a bearish hanging man pattern urges you to short but geopolitical news sends prices flying, the stop loss limits damage, giving you a chance to reassess.
Stop losses are not just protection—they’re also peace of mind. Traders whose capital is protected tend to make calmer, better-informed decisions in the heat of the market.
Position sizing is your way to keep your potential loss within a tolerable range relative to your account size. If a bearish pattern signals a trade, decide in advance how much of your portfolio you are willing to risk on this single setup.
Take a scenario: if your account is PKR 500,000, and you don’t want to risk more than 2% on one trade, that’s PKR 10,000 max loss. Knowing where to set your stop loss helps you calculate your position size. If the distance between your entry and stop loss is PKR 5 per share, you buy or short only enough shares so that a 5-rupee move equals a PKR 10,000 loss.
This disciplined approach prevents any one trade from gutting your portfolio. It also reduces the temptation to overtrade or raise stakes impulsively.
Relying heavily on just bearish patterns or dumping a big portion of your portfolio into similar trades can be risky. Overexposure means a few wrong signals can hit your whole portfolio hard.
Diversification across instruments and markets helps. In Pakistan, this might mean balancing trades in equity stocks on the Pakistan Stock Exchange, alongside currency pairs in forex or commodities like gold.
For example, if multiple bearish candlestick signals are flashing across your tech stocks, it’s smart to resist putting all your eggs in that basket. You could spread capital across different sectors or hold some position in less volatile assets to cushion against a strong sector-specific downturn.
Avoiding overexposure protects you if the overall market mood shifts unexpectedly or if a bearish pattern gives a false alarm. Maintaining diversification is like wearing a seatbelt—it won’t prevent every accident, but it sure reduces harm.
Remember: Risk management is not about avoiding losses completely—it's about keeping losses manageable. Proper stop loss placement and sensible position sizing give you that edge.
In short, mastering risk management in trading bearish candlestick patterns means you trade smarter, not just harder. It saves you from emotional decisions and puts you in a better position to spot and act on genuine market moves.
Traders in Pakistan face unique challenges and opportunities different from global markets, so tailoring bearish candlestick strategies to local conditions is essential. Pakistani markets often show distinct volatility patterns and timings, influencing when and how bearish signals play out. Understanding these nuances can improve trade timing and reduce false signals, making bearish patterns more reliable for decision-making.
Pakistan’s stock markets tend to be influenced heavily by political news, economic reports, and currency fluctuations. During election seasons or announcements like rupee devaluation, volatility spikes can distort typical bearish patterns. For instance, a bearish engulfing pattern might trigger multiple false alarms if sudden news causes sharp but short-lived price swings. Traders should watch periods when volatility is naturally higher and use tight stop losses or wait for additional confirmations, like volume spikes or RSI drops, before committing.
The Pakistan Stock Exchange (PSX) operates roughly from 9:30 am to 3:30 pm local time, aligning with local business hours and different from major international markets. This affects liquidity and price action. Bearish patterns forming close to market close can behave differently than those emerging near open, since fewer participants remain to push prices further. Also, traders should be wary of gaps and price jumps when the market opens after holidays or weekends, as bearish signals formed before these periods might not hold true anymore.
Bearish patterns on blue-chip stocks like Habib Bank Ltd (HBL) or Engro Corporation often carry more weight due to higher liquidity and analyst coverage. Conversely, patterns on lesser-known stocks might not be as reliable due to occasional low volume. In commodities, Pakistan has exposure to gold and oil prices—bearish patterns seen on gold futures traded internationally might affect local market sentiment indirectly. Forex traders dealing in USD/PKR pairs should consider bearish signals in the broader forex market but also factor in local central bank policies that heavily influence currency moves.
Low liquidity can make bearish candlestick patterns harder to trust as price movements could be exaggerated by a few large trades. Pakistani traders should prioritize instruments with solid daily volume to avoid being misled by erratic movements. For example, PSX shares with daily trades in the millions provide clearer pattern signals compared to thinly traded stocks. Similarly, forex pairs like USD/PKR have higher liquidity during overlapping trading hours with international markets, offering better pattern validation chances.
When trading bearish patterns locally, knowing the environment is half the battle. Taking time to understand how local volatility, market hours, and liquidity shape price moves helps avoid common pitfalls and boosts confidence in using these signals.
This practical approach ensures that bearish candlestick patterns aren’t taken at face value but are considered within the full context of the Pakistani trading ecosystem, helping traders make smarter decisions.
For traders navigating the twists and turns of financial markets, having strong resources to learn and practice candlestick analysis is a real lifesaver. Mastering candlestick patterns isn't something you pick up overnight. These resources act like a steady compass, guiding you through the basics to more intricate patterns. They also offer a hands-on approach where you can practice spotting bearish signals without risking your money right away.
By tapping into reliable books, websites, and demo accounts, you get to sharpen your skills, test strategies, and build confidence before jumping into live trading. This approach keeps mistakes and losses in check, which is especially important in volatile markets like those in Pakistan. Plus, practicing regularly helps you spot subtle market movements and better understand how bearish candlestick patterns play out.
To start, it’s best to stick with established books like Steve Nison’s Japanese Candlestick Charting Techniques. It's a classic that walks you through how candlesticks work and why they matter. This book breaks down candlestick basics with clear examples and real charts, making it a solid foundation for beginners.
In addition to books, websites like Investopedia and BabyPips offer straightforward and easy-to-understand tutorials on candlestick patterns. These sites present the info in bite-sized pieces, which helps when you’re juggling other commitments but want to learn steadily.
Why does this matter? Because without a trustworthy foundation, it’s easy to misread signals. These trusted sources build your knowledge so you spot bearish patterns accurately—key for timing your entry or exit in trades.
Once you’re comfortable wit basic patterns, you can dive into more detailed guides and courses that focus on how candlestick patterns interact with other technical tools like RSI, moving averages, and volume indicators. Books like Encyclopedia of Chart Patterns by Thomas Bulkowski provide a deeper dive into complex setups and nuances.
Some online platforms offer video tutorials with live trade analyses that show how bearish patterns perform in real market conditions. These materials push beyond theory and give you a practical edge.
This is essential for traders aiming to step up their game, as understanding the interplay of patterns with broader market data sharpens prediction accuracy and risk management.
Demo accounts provide a risk-free playground where you can apply what you’ve learned without worrying about losing actual money. Most brokerage platforms including PSX’s brokerages or forex platforms like XM and IG offer demo accounts with real-time data.
With demo trading, you try spotting bearish candlestick shapes like the bearish engulfing or dark cloud cover and see how prices actually react. This hands-on experience cements your understanding in a way that reading just can’t.
Practicing with a demo account also helps iron out the jitters newcomers feel when making live decisions. Mistakes here don't cost a dime but teach invaluable lessons on timing, position sizing, and using stop losses effectively based on bearish patterns.
Many Pakistani traders find demo accounts especially helpful since local market volatility can be daunting. Trial-and-error in this safe setup builds the mental muscle required to trust your analysis during real trades.
Taking time to learn and practice using these resources is a smart move for anyone serious about trading, especially in a market like Pakistan’s where prices can swing unexpectedly. Reliable books, clear websites, and demo accounts work together to create a solid base for spotting bearish candlestick opportunities and managing risks confidently.
By combining learning with practice, you’re better equipped to read market signals accurately, avoid common mistakes, and make smarter decisions when the stakes are real.
Master candlestick patterns 🕯️ in trading! Learn how single, double & triple formations guide smarter market moves & boost your investing skills 📈.

📊 Master candlestick patterns for trading in Pakistan! Learn bullish & bearish signals, chart tips, and get handy PDF resources for quick, practical use.

📈 Master advanced candlestick patterns in trading! Learn complex signals, risk management, and how to combine candlestick analysis for smarter market moves in Pakistan.
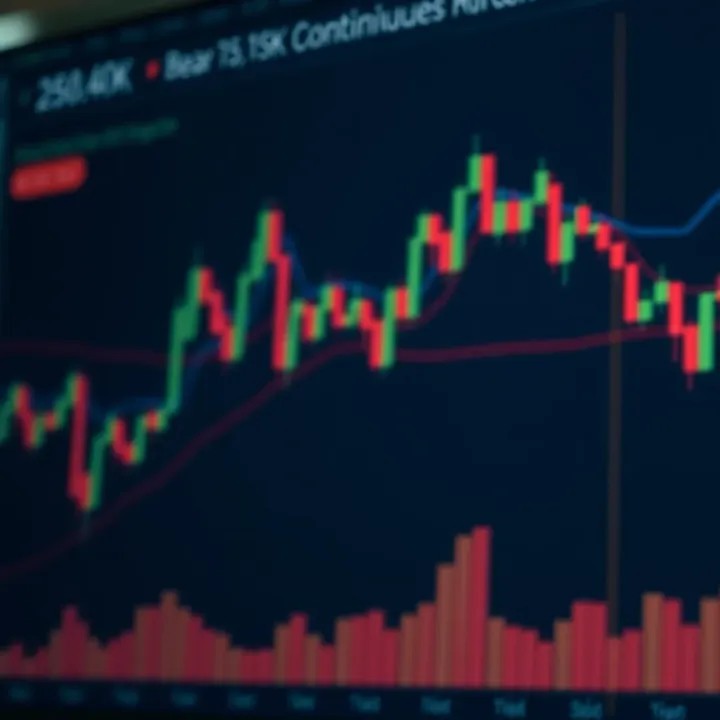
📉 Learn how to spot bearish chart patterns in trading, understand what they mean for price drops, and apply smart risk management to protect your investments.
Based on 5 reviews