
Advanced Guide to Candlestick Patterns in Trading
📈 Master advanced candlestick patterns in trading! Learn complex signals, risk management, and how to combine candlestick analysis for smarter market moves in Pakistan.
Edited By
Charlotte Davies
Candlestick patterns are a fundamental tool for traders and investors looking to make informed decisions in the Pakistani market and beyond. These patterns, formed by the daily price movements displayed on candlestick charts, offer a visual snapshot of market sentiment – whether buyers are in control or the sellers have the upper hand.
Understanding these patterns isn’t just for seasoned traders. Even beginners can gain a lot by recognizing a few key shapes and what they typically signal. From the famous 'hammer' indicating a potential reversal to the 'engulfing' patterns that can hint at momentum shifts, these easy-to-spot formations carry clues about what might come next.

This guide will cover the nuts and bolts of candlestick charts, explain popular bullish and bearish candlestick patterns, and provide tips on interpreting them within real market contexts. We’ll also walk through how to make the best use of PDF resources designed for quick reference, helping you grasp these patterns on the go.
Whether you’re trading stocks on the Pakistan Stock Exchange or navigating cryptocurrency markets, having a solid grasp of candlestick patterns can give you an edge. With practical examples and clear definitions, this article aims to boost your chart-reading skills and confidence.
Remember: No single pattern guarantees a market move. Always combine candlestick insights with other analysis tools and your market knowledge for smarter trades.
Candlestick charts are a cornerstone tool for traders and investors, especially those active in markets like Pakistan's stock exchanges or crypto platforms. Understanding these charts helps you read the market's mood quickly, making it easier to decide when to enter or exit trades. Unlike simple line charts, candlesticks pack a lot of price information into a visually intuitive format.
This section sets the foundation by explaining where candlestick charts come from, why they're widely used, and what makes them stand out against other chart types. The goal here is to equip you with a clear grasp of the basics so you can confidently move on to spotting key patterns and applying them in your trading strategies.
Candlestick charts trace back to 18th-century Japan, originally created by rice traders to gauge supply and demand trends. The method was further refined and introduced to modern Western financial markets by Steve Nison in the late 20th century. The historical roots highlight how traders long ago sought ways to visualize and simplify price action — a need that hasn’t lost its relevance today.
Knowing this history isn't just trivia; it helps you appreciate why candlesticks are so effective at showing trader psychology in a snapshot, capturing emotions like fear and greed. This makes them practical tools, not just pretty graphics.
Compared to line or bar charts, candlesticks provide a richer story by displaying four crucial price points within each period: open, close, high, and low. Line charts only show closing prices, which can miss intraday volatility.
The shape and color of each candle give instant insight into market strength and sentiment. For example, a long green candle indicates strong buying, while a red candle with a long upper shadow might suggest sellers pushed the price down after an initial rally.
In short, candlestick charts bridge the gap between raw data and intuitive understanding, helping traders spot turning points and momentum shifts faster.
Every candlestick tells a story through four numbers:
Open: Price at the start of the time frame
Close: Price at the end of the time frame
High: Highest price during the time frame
Low: Lowest price during the time frame
For example, if a 1-hour candlestick in the Karachi Stock Exchange opens at 100, hits a high of 105, dips to a low of 98, and closes at 103, each of these points displays a slice of market behavior. Traders use these figures to judge momentum and decide their next move.
The thick part of the candlestick is called the body; it shows the price difference between the open and close. A green or white body means closing price was higher than opening, indicating buying pressure. A red or black body means the opposite.
The thin lines extending above and below the body are the shadows (or wicks). The upper shadow marks the highest price reached, and the lower shadow marks the lowest. Long shadows can hint at market indecision or a battle between buyers and sellers.
Understanding the balance between body and shadows helps you read the market’s confidence level. For instance, a small body with long shadows — often seen in Doji candles — usually signals uncertainty.
Candlestick charts transform raw price data into a visual language that tells you not just where prices moved, but how quickly, and with what strength.
This makes them indispensable for traders who want to make informed decisions rather than guesswork.
With this solid grounding, you’re ready to dive into the specifics of bullish and bearish candlestick patterns, and how to apply them with practical tools like PDFs for faster referencing in your daily trading routine.
Recognizing bullish candlestick patterns is essential for traders who want to spot potential buying opportunities early. These patterns serve as signals that market sentiment may be shifting from downtrend or consolidation to an upward move. For investors and traders in Pakistan’s dynamic markets, knowing these patterns can provide a real edge, helping avoid knee-jerk reactions and pinpointing entries with better timing.
Mastering bullish candlestick formations means you can detect moments when buyers are gaining control over sellers. This improves decision-making and lets you align trades with momentum, rather than guessing. Practical examples from stock or crypto markets in Pakistan show how these patterns often coincide with key support levels or follow news events that spark renewed buying interest.
The Hammer candle has a small real body at the top with a long lower shadow, roughly two or three times the size of the body, and little or no upper shadow. It appears after a decline and suggests potential reversal. The Inverted Hammer is the mirror image; it has a small body at the bottom with a long upper shadow and short or no lower shadow. Both need to appear after a downtrend to be meaningful.
It's easy to spot a Hammer on a daily chart of PSX-listed stocks like Mari Petroleum, where after a plunge, a Hammer could indicate buyers stepping in. For the Inverted Hammer, the long upper wick shows that bulls tried to push prices up but ended with a close near the open, warning that the downtrend might stall.
Seeing a Hammer after a selloff suggests buyers are gaining confidence. For instance, during volatile swings in the Karachi Stock Exchange, spotting a Hammer near a historical support price level can hint at a bounce. Confirmation with the next candle closing higher boosts confidence.
The Inverted Hammer, while slightly more cautious, alerts you to potential reversal too. If the next candle confirms by closing above the High of the Inverted Hammer, it supports a shift toward bullish momentum.
A Bullish Engulfing pattern occurs when a smaller bearish candle is followed by a larger bullish candle that "engulfs" the entire body of the previous candle. This indicates strong buying pressure taking over from sellers. The body sizes, color contrast, and their order are key.
You might find this pattern on daily charts for companies like Engro Fertilizers during corrections. It’s a clear visual cue: the bulls didn’t just step in; they pushed strongly against prior bearish control.
When a Bullish Engulfing pattern forms at the end of a downtrend or near a support zone, it points to a potential price reversal. The large bullish candle suggests increased buying interest that can trigger a sustained upward move.
Traders often wait for the close of the engulfing candle to confirm. Following that, volume spikes on the bullish candle add weight to the signal, making it more reliable. In Pakistan’s crowded markets, jumbling through noise, this pattern helps clear out indecision.

This three-candle pattern signals a strong reversal from bearish to bullish sentiment. It begins with a long bearish candle, followed by a short candle (star) that gaps down, showing indecision or a pause. The third candle is a long bullish candle that closes well into the body of the first candle.
On intraday or daily charts of companies like Pakistani tech startups listed on PSX, the Morning Star stands out as a reliable sign that buyers are regrouping after heavy selling.
The Morning Star pattern's significance lies in its clear depiction of market psychology shifting — from fear and selling to hesitation, then confidence and buying.
For traders, spotting this pattern can flag an early entry point ahead of a broader rally. Confirming it with volume increase or other indicators such as RSI can boost confidence. In the context of Pakistan’s often volatile markets, this pattern provides a moment to regroup and potentially capitalize on trend shifts.
Recognizing and trading common bullish candlestick patterns like the Hammer, Bullish Engulfing, and Morning Star helps traders act confidently when the market mood shifts. These patterns are not foolproof but combined with confirmation, they improve your odds of catching meaningful up-moves.
Understanding bearish candlestick patterns is essential for traders who want to anticipate downward market movements. These patterns act as early warning signs that sellers could be taking control, allowing you to safeguard profits or plan exit strategies. In volatile markets like Pakistan's KSE or even in global crypto exchanges, spotting these patterns can be a real edge. Recognizing bearish signals isn’t just about spotting red candles; it’s about knowing the stories these patterns tell about market sentiment and potential reversals. For example, a sudden appearance of a bearish engulfing pattern near a resistance level might indicate buyers are losing steam. This knowledge helps reduce guesswork and boosts confidence in your trades.
Visual cues: The Shooting Star and Hanging Man look similar but appear in different market conditions. Both have small bodies near the day's low or high and long upper shadows that show price rejection. The Shooting Star appears after an uptrend and looks like an inverted hammer—small body at the bottom, long wick on top—showing buyers pushed prices up but sellers pulled it back. The Hanging Man also has a small body near the top with a long lower wick and forms after an uptrend. Spotting these candles requires attention to where they form; a Shooting Star at a resistance can hint at a reversal.
Interpretation in the context of price action: These patterns highlight a shift in momentum. The Shooting Star suggests that although bulls tried to push prices higher, bears stepped in strongly, causing a price retreat. If the following candle closes lower, it confirms selling pressure. Similarly, the Hanging Man warns that despite a previous uptrend, selling pressure is increasing, possibly signaling the trend is tired. Traders can use these signals to tighten stops or consider short positions, especially if volume spikes alongside these formations. In real trading, after noticing a Shooting Star forming on the Pakistan Stock Exchange for a blue-chip like Lucky Cement, a trader might anticipate a pullback.
Appearance and confirmation: The Bearish Engulfing pattern occurs when a small bullish candle is immediately followed by a larger bearish candle that completely covers the prior candle’s body. This shows sellers overwhelmingly overtook buyers in just one session. Confirmation is key—the next candle should ideally close lower to validate this pattern. Without that, the signal might be weak and prone to whipsaws.
How it indicates selling pressure: This pattern visually represents a quick shift from optimism to pessimism. The bigger the engulfing body compared to the previous candle, the stronger the bearish signal. The selling pressure often causes traders to jump ship, leading to further declines. For instance, on the PSX, if a stock like Engro Fertilizers shows a Bearish Engulfing near a resistance zone, it suggests bears are stepping up, which might trigger stop losses and prompt fresh short selling.
Formation and market impact: The Evening Star is a three-candle formation and one of the most reliable bearish reversal signals. It starts with a strong bullish candle, followed by a small-bodied candle (which can be bullish or bearish) showing indecision, and finally a large bearish candle closing well into the first candle’s body. This sequence paints a picture of the buying enthusiasm fading and selling pressure taking over. The market impact can be swift, pushing prices down quickly after this pattern finishes forming.
Use in predicting downtrends: Traders look at the Evening Star as a warning that an uptrend may be ending and a downtrend about to begin. It’s particularly useful on daily or weekly charts where the signal carries more weight. Using this pattern alongside volume indicators or relative strength index (RSI) can improve accuracy. For example, if the Evening Star appears in the top half of a stock’s recent range on the PSX, with declining volume on the last bullish candle and increasing volume on the bearish one, the chances of a downtrend increase. This can prompt traders to adjust their positions or prepare for short trades.
Recognizing bearish candlestick patterns isn’t just about spotting red candles—it’s about reading the market's mood. Learning these patterns' subtle hints and contextual signals helps traders get ahead of reversals before the crowd does.
Understanding the less talked-about candlestick patterns can often give traders the upper hand in spotting market moves before they fully develop. These additional noteworthy patterns don’t usually grab headlines but show up regularly in charts and convey meaningful signals about market psychology. By recognizing and interpreting these patterns properly, traders can deepen their toolkit, avoid common pitfalls, and potentially catch entries or exits with better timing.
Doji candles are unique because they represent moments of indecision in the market where the opening and closing prices are very close, or exactly the same. Unlike long-bodied candles, they show that neither buyers nor sellers had the upper hand during the session, creating a kind of tug-of-war on the chart.
There are several variations of Doji candles, each telling its own story:
Standard Doji: Open and close at the same price, looking like a plus sign. It signals a stalemate between bulls and bears.
Dragonfly Doji: Has a long lower shadow with open, close, and high roughly equal. It suggests sellers pushed the price down but buyers came back strong, hinting at a possible reversal.
Gravestone Doji: Features a long upper shadow with the open, close, and low near the same level, often interpreted as a bearish reversal signal.
Long-legged Doji: Exhibits long upper and lower shadows, indicating extreme indecision and potential volatility.
Traders watching Doji candles need to keep an eye on the context. A Doji appearing after a strong uptrend could warn that momentum is fading. But on its own, a Doji isn’t enough — it signals to look closer rather than act immediately.
In practice, Doji candles are valuable clues rather than outright commands. They often indicate that the current trend is losing steam and that a challenge to the direction could be on the horizon. For example, in Pakistan’s volatile stock markets or cryptocurrencies, a Doji after a solid bullish run might prompt traders to tighten stops or prepare for a possible pullback.
However, Dojis alone don’t guarantee a reversal. They should be used alongside volume analysis or follow-up confirmation candles. Consider the example of a Dragonfly Doji appearing after a harsh price drop in the Karachi Stock Exchange; paired with a strong green candle next day, it might mark the start of a bounce.
These patterns are almost like the yin and yang of sustained price moves—they provide insight into strong, persistent trends.
Three White Soldiers consist of three consecutive long-bodied bullish candles. Each one opens within the previous candle’s real body and closes higher than the last candle’s close, indicating strong and steady buying pressure. This pattern often marks the end of a downtrend or signals a confident shift upward.
In contrast, Three Black Crows show three long-bodied bearish candles in a row, each opening within the previous body and closing lower, suggesting a steady, determined selling trend. This pattern usually warns traders about a solid shift toward the bearish side.
When you spot Three White Soldiers, it’s a sign that bulls have taken control and the price is likely to continue climbing. For instance, if you see this pattern on the Pakistan Stock Exchange after some shaky sideways movement, it might indicate institutional buyers stepping in.
On the flip side, Three Black Crows warn of strong sustained selling. In markets like cryptocurrency, which often swing wildly, this pattern can announce the beginning of a downtrend or a correction phase.
Both these patterns emphasize conviction. Unlike a single candle flickering in uncertainty, they tell you there is a crowd pushing prices firmly in one direction for several sessions, making them reliable indicators for trend-following strategies.
Recognizing these additional noteworthy candlestick patterns gives traders a richer understanding of market moods. By layering this knowledge with volume, support-resistance zones, and broader trend analysis, traders can navigate Pakistan's diverse markets with improved insight and greater confidence.
Candlestick patterns hold a special place in a trader’s toolkit—they provide quick visual clues about market sentiment and potential price moves. However, relying on patterns alone can be like driving a car with one eye closed—useful but risky. To trade well, you need to weave these patterns into a broader strategy that blends technical indicators, volume data, and strong risk-management rules. This section will show you how to mix patterns with other tools and manage risks effectively, making your trades smarter and your losses smaller.
Candlestick patterns are powerful on their own, but they shine brighter when combined with other technical signals. Think of volume and trend indicators as your trading buddies that verify the story the candlestick is trying to tell.
Volume is like the heartbeat of the market. For example, a bullish engulfing candle followed by a surge in trading volume suggests strong buying interest, confirming a potential upward move. Conversely, a pattern appearing on low volume might be a false start. Pairing candlestick signals with trend indicators like the Moving Average Convergence Divergence (MACD) or the Relative Strength Index (RSI) can help confirm whether the market trend aligns with the pattern’s implied direction.
For instance, spotting a morning star pattern near an RSI oversold level adds weight to a bullish reversal signal. These combinations help you avoid chasing half-baked setups and increase the chances for profitable trades.
Never jump the gun on a single candle. Confirmation is about patience rather than speed—waiting for that extra piece of evidence. For example, after spotting a bearish engulfing pattern, a trader might wait for the next candle to close lower, signaling sellers are in control.
Confirmation can also come from other chart tools or price action. If the pattern aligns with a key support or resistance level, and the following price movement backs up the signal, your confidence levels should rise. Without confirmation, you risk mistaking a short-term price wobble for a sustained trend change.
When in doubt, wait for confirmation. It's better to miss one trade than jump into a dud.
Even the best patterns can fail. Managing risk effectively protects your capital and preserves your ability to trade another day.
Stops are your safety net. A smart stop loss placement recognizes how far normal market fluctuations might go without invalidating the pattern. For example, if you enter a trade on a bullish hammer candlestick, placing your stop a few pips below the candle’s low helps you avoid getting prematurely stopped out by typical price noise.
This method minimizes losses while giving the trade enough breathing room to develop. Don't set stops too tight; the market loves to shake traders out with short bursts of volatility.
False signals are like mirages—they look promising but disappear upon closer inspection. To dodge these, avoid placing trades immediately after a single pattern appears, especially if other clues don’t line up. For example, a doji candle without volume support or in the middle of a strong trend might not mean much.
Double-check the pattern’s context: Is it near a support or resistance level? Does it align with longer-term trends? Avoid overtrading on weak patterns. And always factor in market news—unexpected announcements can blow through technical patterns.
In summary, trading with candlestick patterns is like reading a map you still need to cross-check. Blend these visual warnings with volume, trend indicators, confirmation signals, and solid risk management. This approach makes your trading less guesswork and more strategy, protecting your Pakistani market portfolio from typical pitfalls.
PDF resources are a handy tool for traders aiming to sharpen their understanding of candlestick patterns. Having a well-organized guide or chart available offline means you can quickly brush up on crucial patterns without fumbling through endless online articles or videos. For busy traders, especially those active in Pakistan’s dynamic markets, PDFs offer a reliable reference that can be used in real-time during trading hours or while studying after market close.
Using PDFs helps solidify pattern recognition because you can repeatedly review the visual examples alongside explanations, which cements the learning far better than one-off reads. Plus, many PDFs include annotated charts, tips on pattern confirmation, and warnings about common pitfalls — all the kind of details traders need to avoid costly mistakes.
When searching for trustworthy PDF guides, it’s best to rely on established trading education platforms such as Investopedia, BabyPips, or the official sites of brokerages like TD Ameritrade or Interactive Brokers. These sources typically provide free, high-quality materials designed by experienced traders and educators. In Pakistan, platforms like PSX (Pakistan Stock Exchange) also occasionally offer educational PDFs tailored to local market traders.
Avoid shady sites offering PDFs with promises of quick riches; these often lack credibility and may even provide inaccurate information. Instead, look for PDFs that come from known traders or institutions with good reputations. This ensures the patterns and trading advice match real market behavior.
A solid PDF resource for candlestick patterns should include clear, well-labeled charts with real examples. The visuals need to show candles in different contexts — uptrends, downtrends, and sideways markets — helping you see how patterns perform in various scenarios. Good explanations break down why a pattern matters, highlight potential confirmation signals, and suggest where to set stops or targets.
Look for PDFs that are easy to navigate, with a table of contents or an index, so you can quickly jump to the pattern or topic you want. Bonus points if the guide includes practice quizzes or exercises to test your knowledge. Lastly, regularly updated PDFs that reflect current market conditions or recent academic insights add extra value.
Effective studying with PDFs involves more than just skimming through the pages. Take notes as you go — jot down patterns you find tricky or keep a separate checklist of patterns you want to master. Use highlighting tools to mark key points, and periodically quiz yourself on pattern definitions without looking. This active recall strengthens memory.
Another technique is to pair your PDF study sessions with actual chart analysis. Open a live chart on a platform like TradingView or MetaTrader and try spotting patterns that match the examples. This hands-on practice links theory with practice, making it easier to recognize patterns in real market conditions.
Keep your PDF guide open or printed next to your trading setup as a quick look-up tool during your daily market review. When you identify a potential pattern in your charts, cross-check it with the PDF to confirm its structure and significance. This reduces errors caused by rushing or mistaking other candle formations for a specific pattern.
Seasoned traders recommend dedicating 10-15 minutes every trading day to review candlestick patterns using your PDF. Over time, this habit sharpens your instincts and reduces reliance on external tools. Plus, PDFs are lightweight and don’t require constant internet access — a great advantage in areas with unstable connections.
Keeping a trusty PDF at hand can be like having a mentor whispering reminders about trade setups and risk management when things get hectic.
By combining accessible PDF resources with consistent practice, traders in Pakistan can confidently enhance their pattern recognition skills and improve their overall trading performance.
Understanding candlestick patterns is like having a reliable compass in the sometimes chaotic world of trading. For traders in Pakistan, where market conditions can be influenced by both local economic factors and global trends, summarizing these patterns and focusing on practical ways to use them is essential. This section wraps up the key takeaways while offering actionable advice to help traders apply what they've learned in real market scenarios.
Markets in Pakistan can be affected by unique influences like political events, currency fluctuations, and local company earnings reports. For example, Pakistani traders often see sharp moves around budget announcements or changes in the State Bank of Pakistan’s policy rate. Recognizing how such events might impact liquidity and volatility helps traders avoid getting caught in false signals. When a bullish pattern like the Morning Star forms during a period of strong domestic economic data, it's usually more reliable. Conversely, bearish patterns might be more potent during times of political instability.
Understanding the local market's rhythm means you should combine candlestick analysis with awareness of local news flow. It’s not enough to spot a Hammer or Doji candle; you need to ask if the broader environment supports the signal. This approach reduces blind spots, helping you avoid traps where global trends clash with local realities.
Not all patterns carry the same weight, especially in markets as fluid as Pakistan’s. To improve your odds, focus on setups that have shown a history of producing returns under similar conditions. For instance, Bullish Engulfing patterns appearing at key support levels on the Karachi Stock Exchange can be more trustworthy than random appearances.
Look for candlestick patterns confirmed by volume spikes, or those that align with trendlines and moving average supports. Using a checklist before entering trades—such as confirming pattern location, volume support, and recent news—can boost your confidence. It's like fishing with the right bait in the right waters. No matter how great the pattern looks, if it appears during thin volume or against a strong downtrend, it’s better to stay on the sidelines.
Practice makes perfect, especially in reading candlestick charts. Start with free demo accounts on platforms like MetaTrader or TradingView, where you can watch real-time charts without risking capital. Screen recorded past sessions focusing on days when patterns appeared and see how they played out. Many Pakistani traders benefit from downloadable PDF guides that summarize key patterns with examples from local markets — using those to quiz yourself can speed learning.
Creating a trading journal is also a powerful tool. Write down each pattern you spot, your entry criteria, and the outcome. Over time, you’ll notice which setups work best and learn to filter out noisy signals. This hands-on approach beats just reading about patterns because it forces you to engage actively with the material.
You don’t have to go it alone. Engaging with trading communities in Pakistan, like those on Telegram or Facebook groups focused on KSE or crypto markets, gives you access to collective wisdom and real-world discussions. Watch out for seasoned mentors who share detailed analyses and lessons from their trades. These connections are invaluable for tackling tricky concepts and staying updated on market changes.
Mentorship accelerates your learning curve — it’s like having a local guide showing you shortcuts and warning you of common pitfalls. Plus, discussing candlestick patterns within a group helps you spot nuances you might miss solo. Remember, trading is as much about psychology as it is about charts; a community can keep you grounded during losing streaks.
Practical takeaway: Integrate candlestick patterns with an understanding of Pakistan’s market backdrop, focus on high-probability trades, regularly practice using realistic tools, and remain connected with a knowledgeable network. This blend turns pattern recognition from guessing into skillful anticipation.
By focusing on context and continuous learning, Pakistani traders can develop a sharper edge — turning simple candle shapes into meaningful clues that guide smart trading decisions.
📈 Master advanced candlestick patterns in trading! Learn complex signals, risk management, and how to combine candlestick analysis for smarter market moves in Pakistan.
Explore essential chart patterns in technical analysis 📊 for smarter trading and investing. Grab downloadable PDFs 📄 to boost your market insights.
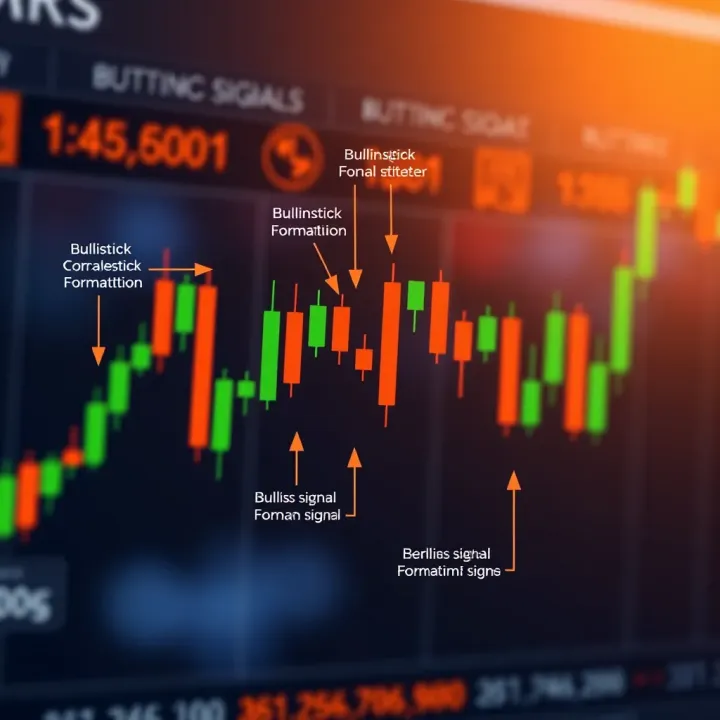
📈 Learn 35 powerful candlestick patterns for trading stocks & forex. Recognize signals, use tips, & download PDFs for deeper insights in Pakistan's market.

📉 Learn how bearish candlestick patterns warn of price drops in trading. Discover key signs, confirmation tactics, and smart risk management strategies.
Based on 5 reviews