
Complete Guide to Reading Candlestick Patterns
Master candlestick patterns 🕯️ in trading! Learn how single, double & triple formations guide smarter market moves & boost your investing skills 📈.
Edited By
Amelia Reid
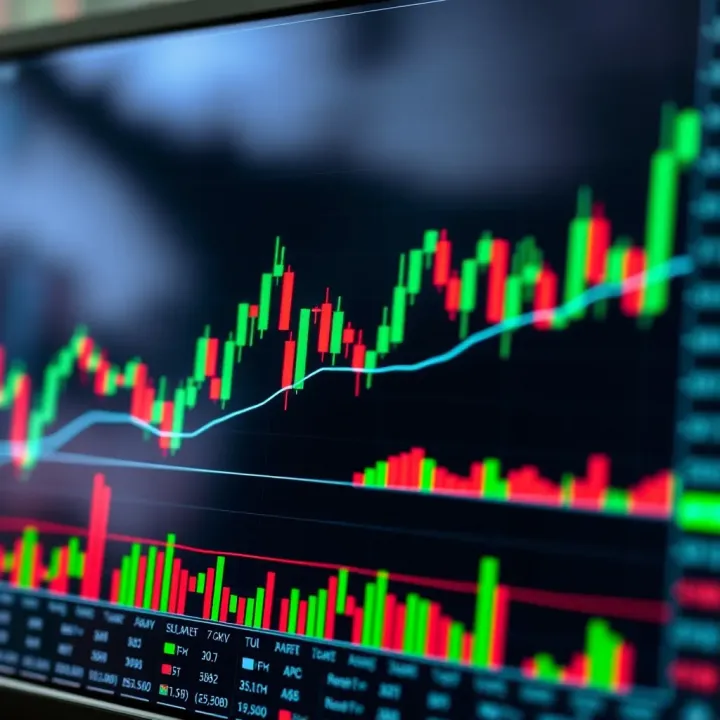
Candlestick patterns form the backbone of technical analysis in forex trading. These visual charts display price movements in a clear format, helping traders pinpoint market turns and momentum. Unlike simple line charts, candlesticks offer more detail — they show opening, closing, high, and low prices for a specific time frame, making trends easier to read.
Each candlestick consists of a body and wicks (or shadows). The body reflects the range between opening and closing prices, coloured differently to indicate bullish or bearish moves — generally green or white for upward movement, red or black for downward. The wicks represent price extremes within the same period.
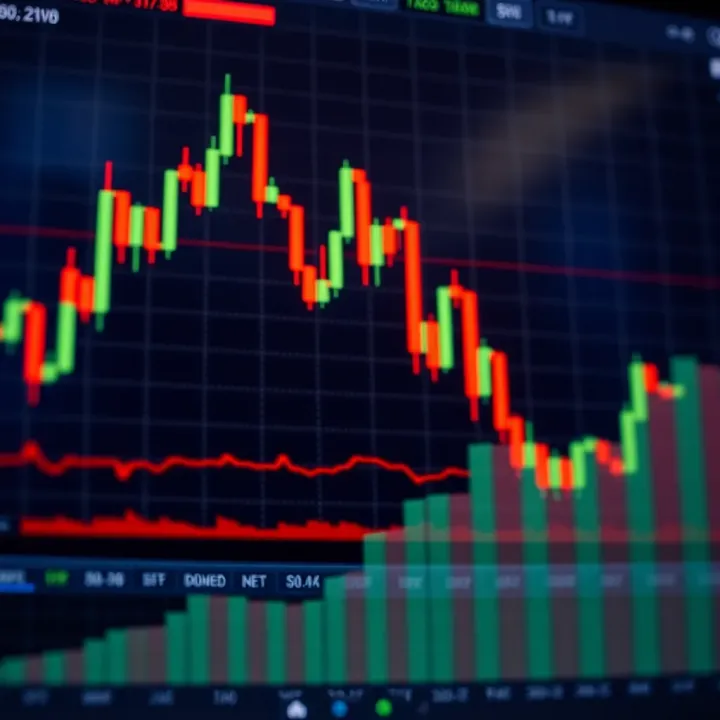
Interpreting these patterns takes knowledge of common formations that signal potential market behaviour. For example, a doji candle, where opening and closing prices are almost equal, suggests indecision in the market, often hinting at a trend reversal. A hammer shows a small body near the top of the range with a long lower wick, indicating strong buying pressure after a decline. Such clues help traders decide when to enter or exit trades.
Successful forex traders combine candlestick patterns with volume and support-resistance levels to confirm signals before acting.
Some widely watched candlestick setups include:
Engulfing pattern: One candle completely covers the previous one, signalling a strong reversal.
Morning star: A three-candle pattern signalling bullish trend reversal.
Shooting star: Often marks the top of an uptrend, warning of a bearish turn.
Knowing these patterns improves your ability to read the market's mood, but relying on candlesticks alone can be risky. They work best when combined with other technical tools and risk management practices. For instance, spotting a hammer candle near a key support level increases confidence in a buy decision.
To get started, practice reading candlestick charts on demo accounts. Watch how patterns evolve in real time and see which ones align with actual price moves. This hands-on approach lets you build experience and sharpen trading instincts, essential for profit in the fast-paced forex markets of Pakistan and beyond.
Candlestick patterns play a vital role in forex trading by helping traders visualise price movements clearly. This introductory section unpacks their origins, structure, and why they matter for traders aiming to read market sentiment accurately. Understanding these basics is essential for making informed decisions in the fast-moving forex market.
Candlestick charts first appeared in 18th-century Japan, developed by rice traders to track price movements more visually than traditional line charts. Their historical context shows why they focus on price action within specific periods, offering more detail than average pricing.
This legacy is practical today because candlesticks highlight patterns that often repeat in modern markets, signalling potential shifts. Pakistani traders can benefit by recognising these time-tested formations for better timing entry and exit points.
A single candlestick consists of four price points: the opening, closing, highest, and lowest prices within a time period. The body—the coloured part—shows the range between opening and closing prices, while the wicks (or shadows) indicate how far price moved beyond these points.
For example, in a bullish candle, the body is typically green or white, meaning the close was higher than the open. This helps traders spot trends and reversals more quickly than just watching price ticks.
Candlestick patterns reveal the battle between buyers and sellers in the market. A long green candle might reflect strong buying pressure, whereas a long red indicates sellers dominating. These visual cues help traders gauge sentiment at a glance.
Imagine a Pakistani trader spotting a “hammer” pattern, which often signals a bullish reversal after a downtrend. This simple visual insight can prevent premature selling and improve timing.
Candlestick patterns act like a language, telling a story about market psychology that numbers alone might miss.
Compared to line or bar charts, candlesticks provide more information in a compact form. Their visual nature allows traders to quickly interpret price action and potential turning points. Also, patterns tend to be easier to spot, aiding faster decision-making.
For instance, while bar charts need careful analysis to identify trends, candlestick charts highlight pauses, indecision, or reversals through formations like Doji or Engulfing patterns. This makes them especially useful in volatile forex markets, such as during Pakistan’s economic announcements when price jumps are common.
Having a solid grasp of these candlestick fundamentals lays the groundwork for more advanced analysis, guiding Pakistani traders towards better strategy formation and risk management.
Candlestick patterns play a significant role in forex trading as they help traders spot potential market reversals or continuations. Understanding these key patterns allows traders to make more informed decisions, improving entry and exit timing. Each pattern reflects the tug of war between buyers and sellers, often signalling shifts in sentiment.
The Hammer and Inverted Hammer patterns suggest a possible upward reversal after a downtrend. A Hammer features a small body with a long lower shadow, showing that sellers pushed the price down during the session but buyers gained control before the close. This indicates strong buying interest near the support level. For example, when the USD/PKR chart forms a hammer after a decline, it may signal a bounce back.
The Inverted Hammer looks similar but has a long upper shadow with a small body near the bottom. Though it shows initial buying pressure, the price closes low, but it hints buyers are trying to step in. Traders should confirm these signals with volume or follow-up green candles before taking action.
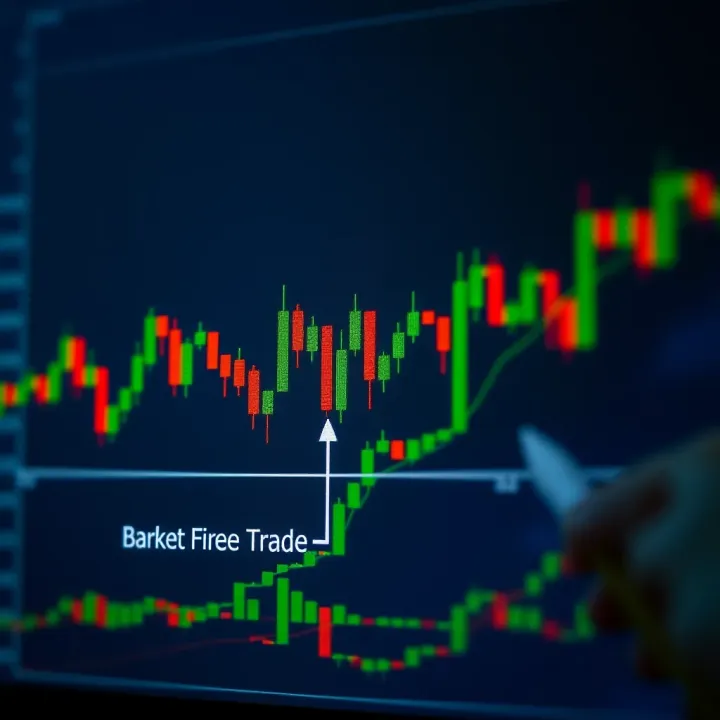
A Bullish Engulfing pattern occurs when a small bearish candle is immediately followed by a larger bullish candle that completely covers the previous body. This shows that buyers have overwhelmed sellers, often marking the start of an uptrend. In volatile forex pairs like EUR/USD, spotting this pattern near support can offer an opportunity to enter long trades.
Traders use Bullish Engulfing to spot strong reversals. Still, volume confirmation and overall trend context are essential to avoid false signals, especially in choppy markets.
The Morning Star is a three-candle pattern signalling a potential bullish reversal. It begins with a strong bearish candle, followed by a small-bodied candle (often a Doji or Spinning Top) that shows indecision. The final candle is a large bullish candle closing well into the first candle's body.
This pattern reflects a shift from selling to buying pressure, often seen after prolonged declines. For instance, on the GBP/USD chart, a Morning Star near a previous support level can be a solid buy signal, confirmed by increasing volume and positive economic news.
The Shooting Star warns about a possible reversal from an uptrend to downtrend. It has a small real body near the day's low and a long upper shadow, indicating that buyers tried to push prices up but failed as sellers regained control.
For example, if the USD/JPY pair forms a shooting star near resistance, it could suggest selling pressure building up, signalling traders to consider selling or tightening stop-loss orders.
This pattern is the opposite of the Bullish Engulfing. A small bullish candle is immediately followed by a larger bearish candle engulfing the previous body. It indicates sellers taking charge, often triggering downward moves.
In currency pairs sensitive to geopolitical events, like USD/INR, Bearish Engulfing near resistance levels should alert traders to possible price drops, but confirming with volume or technical indicators reduces the risk of false alarms.
An Evening Star is a three-candle bearish reversal pattern comprising a big bullish candle, a small indecisive candle, and a large bearish candle closing deep into the first candle’s body. It signals buyers losing momentum and sellers stepping in.
This pattern near resistance zones in forex charts, such as AUD/USD, is a strong hint to exit long positions or prepare for short-selling opportunities.
Doji candles have nearly equal opening and closing prices, forming a cross or plus shape. They indicate market indecision but can suggest continuation when found in the middle of a trend rather than reversal.
In a strong bullish trend on the EUR/GBP pair, a Doji followed by another green candle might show brief hesitation before the price resumes its upward move. However, context is vital — standalone Dojis can also warn about reversals.
Spinning Tops feature small bodies with long upper and lower shadows, signalling balance between buyers and sellers. Like Dojis, they often appear in consolidation phases, indicating that current trend momentum might pause before continuing.
For Pakistani traders monitoring USD/PKR, spotting Spinning Tops during sideways moves may hint that the trend will soon persist, but waiting for a confirming candle is prudent.
Recognising and correctly interpreting these key candlestick patterns can give forex traders a practical edge. Yet, always combine pattern signals with other technical and fundamental analysis to improve reliability and avoid overtrading.
Being able to read and use candlestick patterns effectively can significantly improve your decision-making in the forex market. These patterns give you visual signals about buying or selling pressure and help you anticipate potential market moves. However, spotting the right pattern and using it with context is key to making better trades.
Forex charts are available in different timeframes, ranging from as short as one minute to as long as a monthly chart. The timeframe you choose affects how reliable a candlestick pattern is. For example, a bullish engulfing pattern on a 1-hour chart might not carry the same weight as the same pattern on a daily chart. Longer timeframes usually provide more trustworthy signals because they filter out short-term noise.
Traders need to align chart timeframes with their trading style. Day traders typically use shorter timeframes like 5 or 15 minutes to catch quick moves, while swing traders rely on 4-hour or daily charts to capture larger trends. Using multiple timeframes can also help confirm a pattern's significance.
A candlestick pattern alone might not always tell the whole story. Volume is a key factor that can validate these patterns. High volume on a reversal pattern, for instance, shows stronger market conviction compared to low volume. Imagine spotting a hammer candle at the bottom of a downtrend—if accompanied by a jump in volume, it signals genuine interest among buyers.
Besides volume, combining candlestick patterns with technical indicators such as the Relative Strength Index (RSI) or Moving Averages can improve accuracy. For instance, if a bullish engulfing pattern forms near a 50-day moving average and the RSI is coming out of an oversold zone, the chances of a successful trade increase.
Once you identify a reliable candlestick pattern, you need to translate it into clear entry and exit points. For example, after a bullish engulfing candle in an uptrend, you could enter the trade just above the candle's high. On the flip side, placing a stop loss just below the candle's low limits your risk.
Exit points should be planned based on realistic profit targets or signs of weakening momentum. For example, setting a target near the next resistance level or using a trailing stop loss can help you lock in profits while managing risk.
Candlestick patterns work best when observed near key support or resistance levels. These zones act as natural barriers where price often reverses or consolidates. spotting a hammer candle near support or a shooting star near resistance provides stronger clues about market sentiment.
For instance, if the price is approaching a previous high and you see an evening star pattern forming, it suggests sellers might step in. Conversely, a morning star near a support level signals potential buying pressure. Using these levels in combination with patterns helps avoid false signals and improves trade timing.
Effective candlestick trading is about confirming patterns with context—timeframes, volume, indicators, and price levels—to make smart entry and exit decisions.
Candlestick patterns offer valuable clues about price movements, but relying on them without caution can lead to costly errors. Being aware of common mistakes and understanding the limitations of these patterns is essential for any serious forex trader. This section explains why confirmation matters, the risks of overtrading, and how misreading context can turn good patterns into traps.
Why confirmation is necessary
Candlestick signals never tell the whole story alone. Confirmation using additional tools like volume indicators, moving averages, or support and resistance levels adds weight to the signal. For instance, a bullish engulfing pattern looks promising, but if the volume is low or the price is hitting a strong resistance level, this pattern may fail. Pakistani traders often watch the Pakistan Stock Exchange (PSX) trends alongside candlestick signals; a similar approach benefits forex trades.
Without confirmation, patterns can lead traders to enter or exit too early, exposing them to false breakouts. Taking time to cross-verify with other technical or fundamental indicators protects from losses.
Dangers of overtrading based on patterns alone
Following every single candlestick pattern increases the chances of overtrading. This means making too many trades based on patterns that might not work out, burning capital quickly due to small losses adding up. For example, if a trader acts on every doji or spinning top without filtering by market trend or volume, losses pile up.
Overtrading is especially risky in volatile markets like forex during economic announcements—Pakistani traders must be cautious around events like SBP policy rate decisions when the market is jittery and candlestick patterns might mislead.
Importance of market context
Candlestick patterns should never be interpreted in isolation of wider market conditions. A hammer pattern during a strong downtrend might signal a reversal, but in a sideways or choppy market, it might just mean indecision. Understanding if the market is trending, consolidating, or reacting to news provides vital clarity.
For example, when the PKR/USD exchange rate fluctuates due to government policy changes, traders need to adjust their reading of patterns accordingly. What looks like a reversal might be temporary noise.
Effect of economic and geopolitical events
Events such as elections, trade wars, or global crises impact forex markets dramatically. Candlestick patterns formed right before or during such events can be misleading. A bullish engulfing candle on the rupee-dollar pair may quickly reverse once unexpected news breaks.
Pakistani traders should keep an eye on major economic calendars, like SBP’s monetary policy announcements or IMF talks, which often cause high volatility. Patterns that form without considering these events risk poor decision-making.
Mastering candlestick patterns means respecting their signals but never ignoring the bigger market picture. Combining pattern analysis with context awareness protects you from many common pitfalls.
For traders in Pakistan, adapting candlestick pattern analysis to local market conditions can significantly improve decision-making. The forex market behaviour here is influenced by economic events, geopolitical developments, and liquidity constrained to Pakistan’s trading hours. These practical tips help navigate those nuances for better timing and reliability in trades.
Pakistani forex market volatility tends to spike around specific times, such as during the overlap of London and New York sessions. Traders should pick timeframes matching this volatility to capture meaningful patterns. For example, using 15-minute or 30-minute charts during active hours helps spot changes quickly, while daily charts suit spotting longer-term trends amidst volatility pauses. Volatile periods may cause rapid candlestick formations, so adjusting your timeframe helps avoid false signals.
Economic announcements like the State Bank of Pakistan’s (SBP) monetary policy statement or inflation data release directly impact forex volatility. Avoid entering trades right before these releases, as the market often moves unpredictably. Instead, study candlestick patterns emerging after the dust settles to confirm new trends. Timing trades around Pakistan’s key economic calendar is essential to balance risk and opportunity.
Local brokers commonly offer MetaTrader 4 and MetaTrader 5 platforms, which are robust for candlestick chart analysis and support custom indicators. Some Pakistani traders also use web-based platforms like TradingView for its user-friendly candlestick visualisation and easy access. Choosing a reliable platform with fast execution and local account options allows smoother trading, minimising slippage during critical pattern breakouts.
Using updated economic calendars focused on Pakistan’s key indicators and global events helps traders anticipate volatility around releases. For instance, knowing the exact time of the SBP policy announcement or US non-farm payroll figures lets traders avoid premature entries and better interpret candlestick signals in context. Integrating this calendar with trading alerts ensures you stay ahead of sudden moves affecting pairings like USD/PKR or EUR/USD.
Timing is everything in forex trading. Using candlestick patterns without understanding local market rhythms or major events can easily lead to missteps. Pakistani traders must factor in market hours, economic news, and platform reliability to make the most of their technical analysis.
By aligning your candlestick analysis with Pakistan’s market realities, you increase the chances of spotting genuine trade setups while sidestepping noise and false patterns commonly seen during unpredictable volatility. This balanced approach helps turn candlestick patterns from theoretical tools into practical trading assets.
Master candlestick patterns 🕯️ in trading! Learn how single, double & triple formations guide smarter market moves & boost your investing skills 📈.
📈 Master advanced candlestick patterns in trading! Learn complex signals, risk management, and how to combine candlestick analysis for smarter market moves in Pakistan.
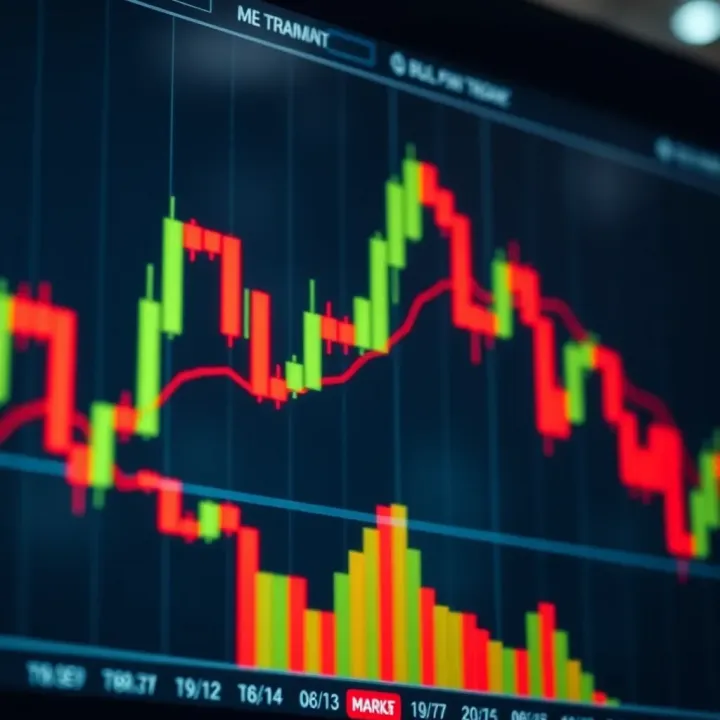
📈 Learn 35 essential candlestick patterns for trading. Understand their shapes, meanings, and how to apply them for smarter market moves and risk control.
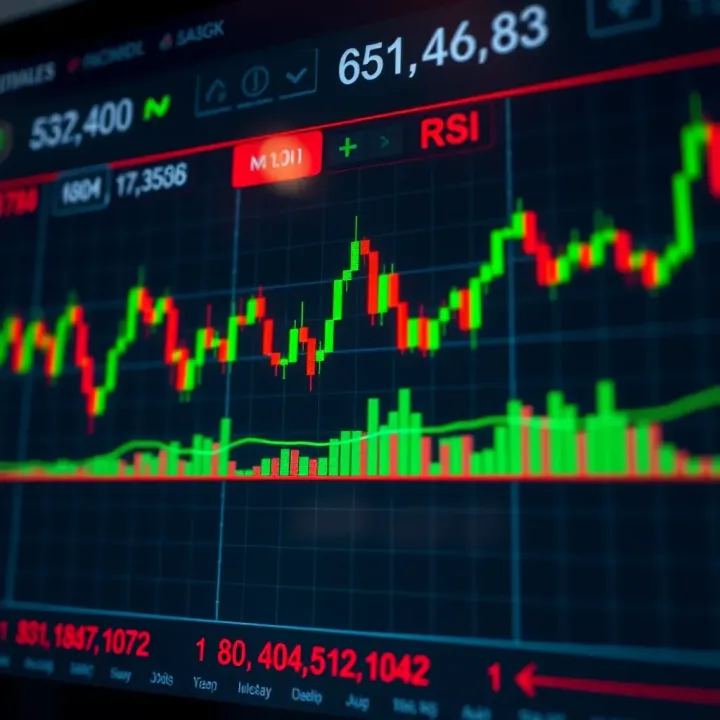
Discover how to choose the right forex trading indicators 📊. Learn types, key qualities, popular picks, avoiding mistakes, and combining tools for smarter trades.
Based on 7 reviews