

Choosing and Using Forex Trading Apps in Pakistan
Explore top forex trading apps in Pakistan 📈 Discover key features, security tips, and tools that enhance your trading decisions for smarter buys and sells.
Edited By
Isabella Hughes
For anyone stepping into the forex market, the sheer number of indicators available can be downright overwhelming. Whether you're a seasoned trader or just dipping your toes in, knowing how to pick the right tool for reading price action often feels like trying to find a needle in a haystack.
This article aims to cut through that noise by laying down a clear path to choosing forex indicators that actually make sense in your trading strategy. We’ll cover everything from what indicators really are, the different types you’ll come across, to what qualities to look out for when deciding which to trust.
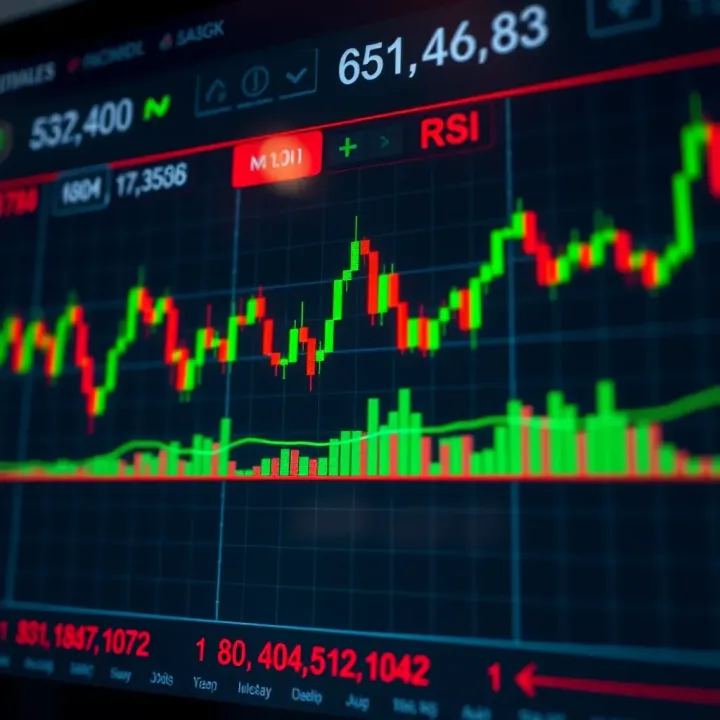
Why does this matter? Because picking the wrong indicator or overloading your chart with too many can leave you more confused than confident. On the flip side, the right indicator simplifies your analysis, helping you make smarter moves and avoiding costly mistakes.
So, if you've ever wondered how traders in Karachi or Islamabad fine-tune their sense for the market or why certain setups just seem to work better in the currency markets — you're about to get a solid handle on it. We’re keeping it practical and clear, so you can take this knowledge and immediately improve your forex game.
Getting a grip on forex indicators is like having a reliable compass in the often unpredictable world of currency trading. These tools aren’t just fancy lines on a chart; they’re essential aids that help traders make sense of market movements and improve decision-making. Knowing how indicators work gives you an edge, whether you're spotting trends, gauging momentum, or timing entries and exits.
Forex indicators are calculations, usually based on price, volume, or open interest data, that help translate market movement into understandable signals. Their main job is to help traders identify current market conditions — whether a currency pair is trending, ranging, or likely to reverse — and assist in making educated guesses about future price directions. For instance, the Relative Strength Index (RSI) measures momentum to show when a pair might be overbought or oversold, alerting traders to potential price corrections.
Indicators act as a bridge between raw market data and actionable insights. They sift through the noise to highlight patterns or conditions that might otherwise go unnoticed. For example, moving averages help smooth out price action to reveal the broader trend, while Bollinger Bands quantify volatility to spot breakout points. By offering visual clues to price behavior, they enable traders to cut through guesswork and base moves on more objective analysis.
These indicators help traders identify and follow the direction of the market movement. Using tools like Simple Moving Averages (SMA) or Exponential Moving Averages (EMA), traders can tell if prices are generally moving up or down. For example, a 50-day EMA crossing above a 200-day EMA might signal an upward trend starting, pushing traders to consider buying positions. They work best in trending markets but might give false signals during sideways, choppy conditions.
Oscillators take on the tricky job of identifying overbought or oversold conditions. The RSI and Stochastic Oscillator are popular examples, bouncing between set values to indicate when a currency might be due for a pullback or bounce. Suppose the RSI hits above 70; this could warn the market is stretched, hinting it's time to prepare for a possible reversal. These tools shine in sideways markets where price ranges tightly.
Volume in forex isn’t as straightforward as stocks, but some platforms provide tick volume, which counts price changes to proxy actual trade volume. Indicators like the On-Balance Volume (OBV) help verify strength behind price moves — if price rises with rising volume, the trend might be sustainable. If price pushes higher but volume dries up, it’s a red flag for a weakening move.
Volatility measures how much price fluctuates over time. Tools like Bollinger Bands or the Average True Range (ATR) highlight how stretched or tight price action gets. For example, contracting Bollinger Bands often precede sharp breakouts, making them valuable for traders waiting to catch the next big move. ATR provides a sense of the average daily price swing, helping to set realistic stop-loss levels.
Understanding these indicators and how they fit your trading style can make or break your success. They’re not crystal balls but smart tools that, when used sensibly, help reduce risk and spot opportunities.
By mastering the types and roles of forex indicators, traders can pick the right tools that sync with their strategy, making trading feel a little less like a shot in the dark.
Picking the right forex indicator isn’t just about grabbing popular tools or watching the pretty lines on your screen. The real deal lies in certain qualities that separate good indicators from the noise. The qualities we discuss here help traders avoid confusion and make smart, timely decisions.
Think of an indicator as your trading buddy—if it keeps letting you down by sending wrong signals, you probably wouldn’t trust it. Consistency means an indicator works well over many trades, not just a lucky streak. For instance, the Moving Average Convergence Divergence (MACD) often holds its ground in identifying trend shifts across different market environments. Indicators lacking this consistency might show impressive results during backtesting but flop when the market doesn't play nice.
Markets are like moods—they can be calm, volatile, trending, or range-bound. An effective indicator should adapt or be relevant across these varying conditions. Take Bollinger Bands, for example: they expand during volatility, showing potential breakout points, and contract when the market calms down, signaling consolidation. If an indicator completely ignores such shifts, it risks giving misleading information, which in trading is almost like running blind.
Ever stared at chart clutter and wondered what on earth to do next? Indicators that produce straightforward, easy-to-read signals save valuable time and headaches. The Relative Strength Index (RSI), for example, clearly points to overbought or oversold zones, allowing quick judgments. If you have to squint or run complicated calculations just to interpret signals, you’ll probably miss key market moments.
Not everyone is glued to their screens or armed with expensive tools. Indicators that are easy to find, free or affordable, and work on popular trading platforms like MetaTrader 4 or TradingView offer an edge. Accessibility means even beginner traders can get started without jumping through hoops. For instance, simple moving averages are readily available and can be customized without fuss, making them a favorite for traders dipping toes in forex.
Forex isn’t just about EUR/USD; it’s a whole basket of currencies each behaving a bit differently. A solid indicator maintains its usefulness whether you’re trading GBP/JPY or USD/TRY. Volume indicators might be tougher on pairs with lower liquidity, so knowing your indicator’s strengths matters. Being versatile means you can use the same setup across multiple pairs, saving time and avoiding the need to relearn tools for each trade.
Trading styles vary—day traders need quick reactions on 5-minute charts, while swing or long-term traders might prefer daily or weekly views. Good indicators work well no matter the timeframe, or at least they let you tweak settings to fit. For example, the Stochastic Oscillator can be adjusted to highlight short-term momentum or smoother trends over longer periods. Without this flexibility, your indicators might either flood you with noise or miss the bigger picture.
In short, the best forex indicators marry reliability, ease of use, and flexibility. When these qualities come together, your trading decisions get stronger and more confident, cutting through the guesswork and noise typical of foreign exchange markets.
Knowing which forex indicators to use can make or break your trading. Popular indicators have stood the test of time because they’re practical, offering clear insights into market behavior. They help simplify the messy business of predicting price moves, making it easier to spot trends, momentum shifts, or volatility changes.
For example, using just one well-known indicator like Moving Averages can help you track the market’s mood, whether it's bullish or bearish. Combine that with RSI or MACD, and you get a fuller picture, reducing guesswork. Most traders prefer these common tools because they’re tested and fit well into many trading styles.
Moving Averages smooth out price data to help you see the bigger picture. The Simple Moving Average (SMA) takes an average of prices over a set period, like the past 50 days, weighing them equally. The Exponential Moving Average (EMA), however, gives more importance to recent prices, reacting faster to new market action.
Here’s the gist: if the forex pair suddenly spikes or dips, EMA picks it up quicker, which is handy for short-term traders. SMA suits those who want a gentler read, filtering out the noise. For instance, a 20-day EMA could alert you to a quick shift in the EUR/USD pair sooner than the 20-day SMA.
Once you pick your preferred moving average, the next step is spotting trends. When prices stay above the moving average, it signals an uptrend; below it could mean a downtrend. Crossovers between short-term and long-term averages, like the 50-day and 200-day, can indicate potential trend changes.
For example, if the 50-day EMA crosses above the 200-day SMA, traders often see this as a bullish sign, sometimes called the "golden cross." Keep in mind, though, moving averages lag behind price because they're past-focused, so confirm with other indicators.
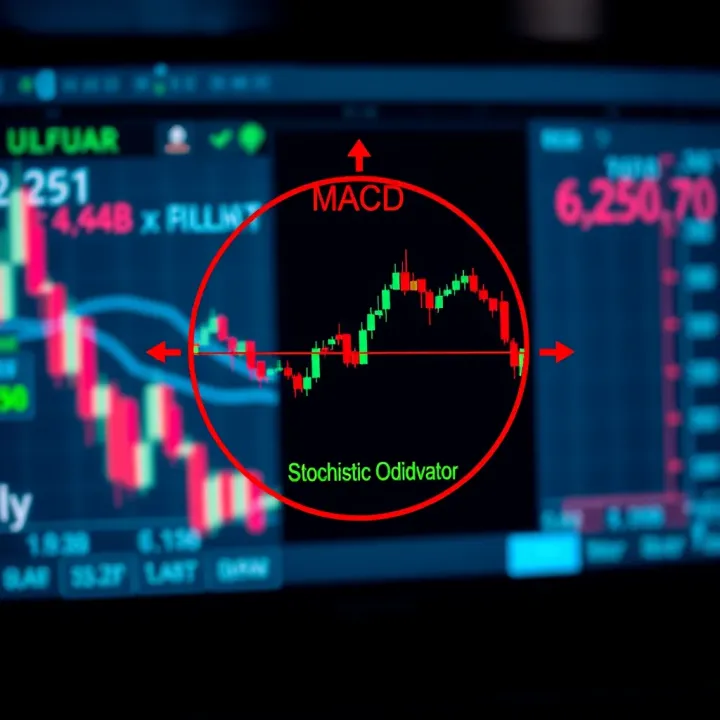
RSI measures the speed and change of price movements on a scale of 0 to 100. Traditionally, a reading above 70 indicates an overbought market—you might think prices have risen too high, too fast, and a pullback is likely. Conversely, under 30 suggests oversold conditions, hinting at a possible bounce back.
Traders often use RSI to avoid jumping into trades at the wrong moment. For example, if the GBP/JPY seems strong but the RSI is above 70, that might be a warning sign to hold off from buying.
RSI doesn’t just tell you if prices are overextended; it also measures momentum. A rising RSI means increasing buying pressure, while a falling RSI indicates growing selling pressure. Watching RSI divergences—when price moves one way and RSI another—can reveal hidden weakness or strength.
Suppose USD/CAD price makes a new low, but RSI forms a higher low; this bullish divergence can hint the downtrend is losing steam, suggesting a buying opportunity.
MACD is a versatile indicator that looks at relationships between two EMAs (usually 12-day and 26-day). When the fast EMA crosses the slow one, it can signal a trend change. This makes MACD a favorite among traders for spotting reversals early.
For instance, if MACD crosses above its signal line after a downtrend in AUD/USD, it might indicate bullish momentum building up.
The signal line is a moving average of the MACD itself, usually the 9-day EMA. When MACD crosses above the signal line, it’s a buy signal; crossing below suggests selling. The clearer these crossovers are, the easier it can be to time entries and exits.
Keep in mind, false signals can happen, especially in choppy markets, so it’s smart to use this with other indicators or price action.
Bollinger Bands consist of a middle SMA line and two bands above and below, which widen and contract based on market volatility. The wider the bands, the higher the volatility; narrower bands imply calmer markets.
For traders dealing with volatile pairs like USD/ZAR, Bollinger Bands help gauge when price swings might get wild or settle down.
When price breaks out above or below the bands, it can suggest a strong move is underway. However, it’s not always a signal to buy or sell immediately because prices can "walk the band" during strong trends.
A useful tip: look for confirmation in volume or other indicators before acting on a Bollinger Bands breakout to avoid getting caught in false moves.
A well-chosen combination of these popular indicators gives traders clearer signals and more confidence in their decisions. While none guarantees success alone, using them thoughtfully can tip the odds in your favor.
Picking the right forex indicator isn't a one-size-fits-all deal. Different trading styles demand different tools to match their pace and priorities. Whether you're darting in and out within minutes or holding onto positions for weeks, your choice of indicators should support your unique rhythm and goals. This section breaks down how to select indicators that suit day traders, swing traders, and long-term traders.
Day trading thrives on quick decisions and nimble reactions. Indicators for day traders need to deliver signals that reflect rapid market changes without lagging behind. Tools like the Stochastic Oscillator and the short-term Exponential Moving Average (EMA) are favorites because they react swiftly to price moves, helping traders catch momentum before it fades. The goal is to avoid waiting around for slow indicators that might cause you to miss critical entry or exit points.
Common indicators tailored for short bursts include:
5- and 10-period EMA: These help identify short-term trend shifts almost in real-time.
Stochastic Oscillator: Useful for spotting overbought or oversold conditions on minute charts.
Volume Weighted Average Price (VWAP): Day traders use VWAP to track average price relative to volume, which can highlight real-time support and resistance.
These tools keep you agile, providing clear signals on smaller timeframes like 1, 5, or 15 minutes.
Swing traders sit between day traders and long-term investors, holding positions for days or weeks. Their indicators need to balance timely signals with reliability, avoiding too many false alarms. This means smoother indicators that filter out market noise but still catch emerging trends.
Indicators that swing traders often lean on include:
Relative Strength Index (RSI): Helps gauge momentum over 14 days or more, highlighting potential reversals.
MACD (Moving Average Convergence Divergence): A classic tool that captures trend shifts by comparing different EMAs.
50-period Simple Moving Average (SMA): Offers a clear picture of medium-term trend direction.
These tools work well on 4-hour to daily charts, assisting traders in spotting and riding price waves without being misled by quick spikes.
Long-term traders aim to ride significant market moves, so their indicators must focus on identifying and confirming strong, sustained trends. Speed isn’t as critical here; accuracy and trend strength confirmation take priority.
Due to their slower response, lagging indicators suit long-term strategies well. Some popular choices are:
200-period Simple Moving Average: Widely regarded as a trend barometer, it filters out the short-term noise.
Parabolic SAR: Helps spot potential trend reversals but does so after the trend has established.
ADX (Average Directional Index): Measures trend strength regardless of direction, guiding traders on whether to stay put or take profits.
These indicators help long-term traders stay patient and avoid jumping on fleeting moves, focusing instead on big-picture trends.
Choosing the right indicator based on your trading style isn't just about trading smarter; it’s about trading your way.
In summary, understanding your trading style guides you to the indicators that best complement your approach. Day traders need rapid-fire signals, swing traders rely on a balance of speed and accuracy, and long-term traders benefit from indicators confirming sturdy trends. Tailoring indicators to your style improves your decision-making and can enhance overall performance.
Using multiple forex indicators at once can often paint a clearer picture than relying on a single tool. When combined thoughtfully, indicators can complement each other to reduce the risk of false signals and provide stronger confirmation for trades. The key is knowing how to pair them effectively without overwhelming your chart or causing conflicting signals.
The first step to combining indicators is understanding which ones naturally work together based on what they measure. For example, pairing a trend-following indicator like the Moving Average (MA) with a momentum oscillator such as the Relative Strength Index (RSI) can balance out the strengths and weaknesses of each tool. The MA tracks the overall direction, while RSI helps spot overbought or oversold conditions that might signal an upcoming reversal. Avoid stacking two indicators that react similarly because they tend to echo the same signals instead of confirming each other.
Keep in mind that too many indicators can clutter your screen and cause overwhelm, often referred to as "analysis paralysis." Stick to 2 or 3 at most, and make sure they serve distinct purposes—trend direction, momentum, and volatility, for instance. This methodical approach helps avoid contradictory signals that leave you guessing.
Using multiple indicators is especially useful for confirming trade entries and exits. Say the MACD shows a potential bullish crossover; you might want to see if the Bollinger Bands indicate a price breakout and the RSI isn’t indicating an overbought level before pulling the trigger. This layered confirmation reduces the likelihood of jumping into a trade prematurely.
This approach is practical no matter your experience level. It’s like getting a second or third opinion in medicine—confirming the diagnosis before starting treatment. Done right, it can elevate your confidence and improve your success rate.
Crafting a strategy using multiple indicators requires a clear plan. Start by selecting your core indicator to identify general market trends. Next, add an oscillator to assess momentum, and perhaps a volatility indicator like Bollinger Bands to gauge potential price swings. Test how these indicators behave together on different timeframes.
Here’s a simplified example:
Use the 50-day Exponential Moving Average (EMA) to identify whether the market is trending up or down.
Check the RSI to ensure momentum supports the trend and to avoid overbought or oversold traps.
Look at Bollinger Bands to catch potential breakouts or pullbacks within the trend.
This process is iterative—don’t hesitate to tweak and replace indicators depending on how well they fit your trading style and the currency pairs you focus on.
Before risking actual money, testing your combined indicators against historical data is critical. Many platforms, like MetaTrader 4 or TradingView, offer built-in backtesting tools where you can simulate trades based on your setup. This not only validates your strategy’s effectiveness but also builds comfort with the signals it produces.
Additionally, paper trading (simulated trading with virtual money) provides a no-risk environment to fine-tune entry and exit rules based on multiple indicators. This helps identify any quirks or inconsistencies in your strategy during real-time market conditions.
Backtesting and paper trading are like a rehearsal before the main event—they reveal the rough spots and give you a smooth performance.
By carefully combining indicators, confirming signals, and testing strategies rigorously, you’ll be better positioned to identify high-probability trades and manage risk more effectively. This methodical approach generally beats relying on gut feeling or a single indicator alone.
Indicators are handy tools in forex trading, but they come with traps that new and even seasoned traders can fall into. Knowing these pitfalls helps you avoid costly mistakes and makes your trading more solid. This section covers two big hazards: overusing indicators and ignoring market context.
Traders sometimes cram their charts with too many indicators, aiming to catch every possible signal. The result? A cluttered mess that's hard to read. When screens look like a spaghetti bowl with lines and colors everywhere, making clear decisions becomes a nightmare. For example, stacking multiple moving averages, RSI, MACD, and Bollinger Bands without a clear plan can drown out real signals.
To keep things tidy, focus on a few indicators that complement each other. For instance, pairing a trend indicator like the Exponential Moving Average (EMA) with a momentum tool such as RSI can give both a direction and strength signal without overwhelming you.
This happens when traders get stuck trying to interpret conflicting signals from many indicators. Imagine staring at charts all day, juggling signals from five or six indicators, and never pulling the trigger because you’re never quite sure what’s going on. This overthinking stalls timely decisions and causes missed opportunities.
To avoid paralysis, pick a handful of trusted indicators and stick with them. Trust your setup but give yourself simple rules for when to buy or sell. For example, you could decide to enter trades only when both the MACD and RSI confirm an entry, avoiding second-guessing from other mixed signals.
Indicators crunch numbers based on price data, but they don’t account for big events like interest rate decisions, geopolitical tensions, or major economic data releases. These events can cause sudden price swings that indicator signals may not predict or handle well.
For example, a simple moving average crossover might suggest holding a long position, but if a surprise economic report just slammed the currency, that signal could quickly turn into a losing bet. Always keep an eye on the economic calendar and news feeds to understand the bigger picture.
No indicator is perfect or offers a crystal ball. They’re based on past price movements and can lag market changes. Indicators like Moving Average Convergence Divergence (MACD) or RSI can signal an overbought condition even as the price keeps climbing.
Understanding this limitation means never relying solely on indicators. Instead, combine them with price action, volume data, and an awareness of market sentiment. For instance, watching for price support and resistance levels alongside indicator signals can give a more complete picture.
Using indicators is not a "set-it-and-forget-it" approach. They require context, moderation, and critical thinking to work effectively in real-world trading.
In short, avoiding these pitfalls will make your use of forex indicators smarter and less risky. Keep your charts clean, don't get stuck in over-analysis, and always read the market’s story beyond just what the numbers say.
When it comes to forex trading, knowing how to use your indicators right can make all the difference. Indicators are tools, not magic beans. They need to be applied correctly to give signals that can actually help you make smart moves. This section zeroes in on some practical advice that traders often overlook but can't afford to ignore if they wish to boost their chances of success.
Before throwing your hard-earned cash behind any indicator, backtesting is a must. It means running your chosen indicator through past market data to see how it would have performed. For example, if you like the Relative Strength Index (RSI) set to a 14-day period, try it on historical charts from different currency pairs like USD/PKR or EUR/USD. This reveals whether RSI would have reliably shown overbought or oversold zones that precede price reversals.
Using historical data helps you avoid flying blind. It’s like test-driving a car rather than buying without seeing how it handles on the road.
Validating indicator performance means checking if the signals from your indicator lead to profitable trades over time or if it’s just noise. Traders sometimes get stuck in the trap of pouncing on random signals, only to lose money repeatedly. By systematically analyzing the outcome of trades signaled by your indicator, you can figure out if it genuinely suits your trading style or needs adjusting.
Markets don't sit still—they move, change, and throw curveballs. So, what worked last month might not hold up today. That’s why adjusting settings on your indicators is crucial. Let’s say you use Bollinger Bands with a 20-period moving average and a 2 standard deviation setting. If volatility spikes during certain sessions or due to geopolitical news, tweaking these parameters can make your bands more responsive and reduce false breakouts.
Similarly, staying updated with market changes is key. Economic releases, political events, and central bank announcements can drastically alter trend patterns or volatility levels. Traders who tune their indicators proactively often spot shifting market conditions early, giving them a leg up. Following local news sources, economic calendars, and insights from brokers like FXTM or IG Markets can keep you in the loop.
In short, using indicators effectively is not a "set it and forget it" game. It takes regular homework and willingness to refine your approach as the market evolves.
Always backtest indicators with real historical data to see how they perform.
Validate if signals lead to gains or just confusion before relying heavily.
Adjust indicator settings to match current market conditions rather than sticking rigidly.
Stay alert to news and events affecting currency pairs you trade.
Applying these practical steps helps traders in Pakistan and beyond build more reliable trading strategies that are grounded in evidence and adaptability.
Explore top forex trading apps in Pakistan 📈 Discover key features, security tips, and tools that enhance your trading decisions for smarter buys and sells.

Looking for the best forex trading platform in Pakistan? Discover top features, security tips, and cost comparisons to match your trading style and needs! 💹🇵🇰
Looking for the best forex trading app in Pakistan? Discover top-rated platforms with reliable features, easy use, and secure trading options 📱💰
Find the best forex broker in Pakistan 🇵🇰 with our practical guide! Learn about regulations, platforms, fees, & support to trade smartly and safely 💹.
Based on 11 reviews