

Complete Guide to Reading Candlestick Patterns
Master candlestick patterns 🕯️ in trading! Learn how single, double & triple formations guide smarter market moves & boost your investing skills 📈.
Edited By
Charlotte Evans
Candlestick charts are a popular tool among traders and investors to understand price movements in financial markets. Unlike simple line charts, candlestick charts show opening, closing, high, and low prices within a specific time frame, giving a fuller picture of market sentiment.
Each candle has a body and wicks (shadows). The body represents the price range between open and close, while the wicks reflect the highest and lowest prices during that period. A bullish candle closes higher than it opened, usually shown in green or white, while a bearish one closes lower, typically red or black.

Understanding individual candle types helps you spot potential market reversals or continuation trends. For example:
Doji: A candle with almost the same open and close price, suggesting indecision.
Hammer: A candle with a small body near the top and a long lower wick, indicating possible bullish reversal after a downtrend.
Shooting Star: Opposite of hammer, signalling potential bearish reversal after an uptrend.
Combined patterns like Engulfing, Morning Star, and Evening Star offer stronger signals by capturing multiple candles’ behaviour. For instance, a bullish engulfing pattern shows a small bearish candle followed by a larger bullish candle that completely covers it, hinting at upward momentum.
These patterns gain significance when confirmed by other technical indicators or market context, such as volume or trend lines.
In Pakistan’s market context, candlestick patterns prove handy for trading stocks on the Pakistan Stock Exchange (PSX) or commodities sensitive to global cues and local conditions. When paired with factors like rupee volatility or political developments, these patterns guide you in making more informed decisions.
To use these patterns effectively:
Identify the current market trend.
Watch for candlestick patterns at support and resistance levels.
Confirm signals with other tools like RSI or moving averages.
Manage risk with stop-loss orders.
By mastering candle charts and their patterns, traders and investors can sharpen their timing and anticipate price reversals or continuations. This helps avoid emotional decisions, especially in volatile markets affected by unpredictable factors like loadshedding or geopolitical events.
Starting with candlestick basics will make your technical analysis stronger and improve your chances of smart trading in the Pakistani financial landscape.
Understanding candle chart patterns helps traders read market behaviour through price movements in a simple yet effective way. These patterns distil complex price data into visual shapes, giving insights into potential trend directions. For Pakistani investors dealing with volatile markets like KSE-100 or the foreign exchange market, recognising these patterns can make the difference between profit and loss.
A single candlestick conveys four key price points: the open, close, high, and low within a specific time frame. The rectangular body shows the range between the open and close. Thin lines above and below the body, called wicks or shadows, mark the high and low prices during that period. This compact visual gives more context than basic line charts.
The open price is where trading starts in the chosen time frame, and the close price is where it ends. Meanwhile, the high and low prices capture the peak and the trough reached before the period closed. For example, in Pakistani early morning trading hours on the Pakistan Stock Exchange, a candlestick might show price opening at Rs 150, dropping to Rs 147, going up to Rs 155, and finally closing at Rs 153. Traders study these to judge buying and selling pressure.
Candle colours signal market mood—typically green or white for bullish (price rising) and red or black for bearish (price falling) movements. A large body indicates strong buying or selling momentum, while a small body, often called a Doji, suggests indecision. For example, a long red candle on a company’s share in Lahore’s stock market can imply heavy selling that day, alerting traders to possible downtrend.
Candle patterns form readable signals for entry, exit, or holding decisions. Patterns like bullish engulfing or hammer indicate reversals, while others suggest trend continuation. Traders in Karachi’s FX market watch these patterns to anticipate shifts before volume confirms a move, allowing timely decisions.
Each pattern reflects collective trader behaviour. For example, a hammer pattern signals sellers tried to push prices down but buyers regained control, showing a shift in market sentiment. This behavioural insight helps traders understand underlying strength even if macroeconomic news is absent.
While powerful, candlestick patterns shouldn't be the only tool. Markets can be affected by news, policy changes, or big institutional trades, which candles alone won’t reveal. In Pakistan’s market, integrating candlestick analysis with volume, moving averages, or economic indicators reduces risks of false signals.
Always use candle patterns as part of a broader strategy rather than standalone predictors to make effective trading decisions.
This introduction sets the foundation for using candle charts effectively in trading, especially within the unique dynamics of the Pakistani financial markets.
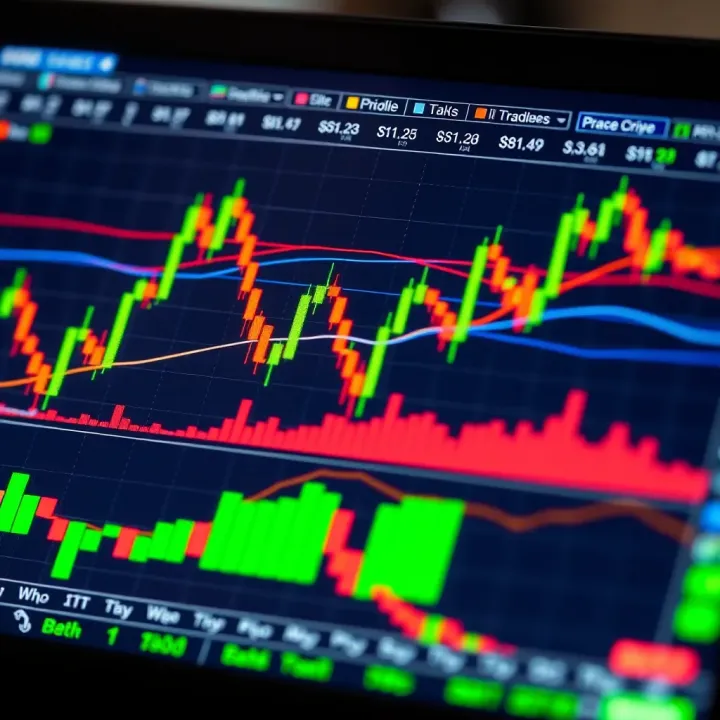
Single candlesticks can tell a big story about market sentiment in a compact visual. Knowing how to read these individual candles can help you catch early signals of shifts in momentum, especially when trading stock, forex, or crypto in Pakistan's markets. Each type of single candle conveys a different level of confidence or hesitation among traders.
The Doji candle stands out for its almost equal open and close prices, forming a thin cross or plus sign shape. This pattern shows equilibrium between buyers and sellers with no clear winner over a given period. For example, after a strong rally in PSX shares, spotting a Doji could hint the bullish momentum is wavering before the market decides its next move.
A Doji alone doesn't promise a reversal but suggests traders pause to reassess. Look for confirmation in following candles or volume changes before making a call.
Hammer and Hanging Man look alike but warn differently depending on prior price action. Both have small bodies near the upper end with a long lower wick.
Hammer appears after a downtrend and indicates potential bullish reversal. If a KSE-100 index stock forms a hammer, chances of buyers stepping in increase.
Hanging Man appears after an uptrend and signals possible bearish reversal. Traders should be cautious if a popular oil sector stock shows this pattern during a rally.
Both candles highlight trader hesitation; the long wick shows rejection of lower prices (hammer) or warning sellers may start dominating (hanging man).
Though less common, the shooting star and inverted hammer offer valuable reversal clues:
Shooting Star occurs during an uptrend with a small body at the lower end and a long upper wick, signalling a price rejection at highs and potential sell-off. For instance, if a tech company share listed on PSX suddenly forms a shooting star after gains, short-term sellers might take control.
Inverted Hammer comes at a downtrend's end; small body near low prices and a long upper wick hints buyers trying to push higher. This could signal the downtrend losing steam in the volatile futures market.
Traders should combine these signals with other tools like volume spikes and support levels on Pakistani charts for better accuracy.
Understanding these single candle types sharpens your ability to spot moments when market sentiment shifts. They work as early warnings to keep you ready for changes, making your trading approach more responsive and informed.
Combined candle patterns offer a clearer picture of market sentiment than single candles alone. These patterns, formed by two or more consecutive candlesticks, help traders spot stronger signals about potential price reversals or continuations. Especially in the Pakistani market, where volatility and sudden trend shifts are common, understanding these patterns can improve timing for entry and exit points.
Look, a single candle might show indecision or strength briefly, but combined patterns tend to reveal more reliable signals. For example, a confirmation of a trend change through patterns like the engulfing or morning star offers traders more confidence before committing capital. However, like any tool, candle patterns should be used alongside other analysis methods such as volume and support/resistance levels to avoid false signals.
The bullish engulfing pattern occurs when a small bearish candle is immediately followed by a larger bullish candle that completely covers the previous candle’s body. This pattern suggests buyers have taken control, signalling a possible reversal from a downtrend to an uptrend. Imagine a stock on Pakistan Stock Exchange (PSX) dropping steadily amidst bearish pressure; a sudden bullish engulfing could hint at a recovery, prompting traders to look for buying opportunities.
For instance, if Hub Power Company’s (HUBC) daily chart shows a clear bullish engulfing near a support level, traders may consider entering long positions with a stop loss below the pattern. But remember, it’s best combined with volume increase, which confirms buying interest.
On the other hand, the bearish engulfing pattern shows the opposite. Here, a small bullish candle is followed by a larger bearish candle that swallows the previous day’s gains, signalling sellers’ dominance and a potential downtrend. This pattern can be spotted during rallies that suddenly lose steam, warning traders about a coming drop.
Consider a rally in Oil and Gas Development Company Limited (OGDCL) where after a few green candles, a bearish engulfing appears. This warns investors of a possible reversal and helps in planning exit points or short positions. Again, volume confirmation and observing nearby resistance levels boost the pattern’s reliability.
The piercing line pattern happens after a downtrend when a bearish candle is followed by a bullish candle that closes above the midpoint of the bearish one. It hints at buying interest gaining momentum but stops short of a full reversal signal. Traders may use this to anticipate that bears are losing power, preparing to shift stance if further bullish confirmation appears.
Conversely, the dark cloud cover appears following an uptrend, where a strong bullish candle is succeeded by a bearish candle that closes below the midpoint of the bullish candle. This pattern warns about weakening buyer control and possible bearish reversal ahead. For traders in the Pakistani market, spotting these around significant resistance or support can prove useful before making quick decisions.
The morning star is a reliable three-candle bullish reversal pattern. It starts with a strong bearish candle, followed by a short-bodied candle (indecision), then a solid bullish candle closing well into the first candle’s body. This sequence signals a shift from selling pressure to buying interest, often useful after prolonged declines.
The evening star flips this setup, signalling bearish reversal after an uptrend. It begins with a bullish candle, followed by a doji or small body showing hesitation, and then a bearish candle closing deep into the first candle's range. For traders, these patterns serve as early warning signs to adjust positions.
Finally, the three white soldiers pattern is a strong bullish indicator, formed by three consecutive long-bodied bullish candles each closing higher. It demonstrates sustained buying over several sessions and confirms a robust uptrend.
In contrast, the three black crows pattern shows three straight bearish candles, each closing lower than the previous, signalling steady selling pressure and a possible downtrend. Monitoring these patterns alongside Pakistani market news, volumes, and support/resistance levels helps in confirming trend strength and momentum.
Combined candle patterns provide strong cues on market sentiment shifts but require real-time market context and confirmation through other tools for effective trading decisions.
Understanding these patterns sharpens your market view, helping you trade with more confidence in a fast-moving environment like Pakistan's equity and commodity markets.
Traders in Pakistan often rely on candlestick patterns to get a practical edge in markets like PSX or the forex segment. Using candle patterns alone, though, isn’t enough—you need to combine them with other technical indicators for better decision-making. This approach helps adapt global trading techniques to our local market quirks, such as volatility influenced by political events or economic data releases. For instance, a candlestick reversal pattern after a notable support level with high trading volume in a blue-chip stock like OGDC can be a strong buy signal.
Volume acts like a reality check for candlestick patterns. When a bullish engulfing pattern appears on the KSE-100 chart, for example, confirming it with above-average volume increases the pattern's reliability. Without volume support, a pattern might just be noise, especially in thinly traded stocks. Volume surges signal genuine interest, so Pakistani traders looking at shares with low liquidity must be cautious and ensure volume backs pattern moves.
Candlestick patterns show their real power when aligned with key support and resistance points. Let's say a hammer candle forms near a well-established resistance line on the Pakistan Oilfield share price. This might suggest a selling opportunity by locals, anticipating a price drop. Similarly, spotting a morning star pattern close to a support zone like the lower Bollinger Band can strengthen a trader’s confidence about a bounce.
Moving averages smooth out price action and highlight trends, which blend well with candle pattern analysis. For example, if a gold share forms a three white soldiers candle pattern above its 50-day moving average, it confirms bullish momentum. In contrast, bearish candle signals near or below moving averages like the 100-day can warn of further decline. Many Pakistani traders track MA crossovers along with candles for clearer entry or exit points.
Spotting true trend reversals is challenging but essential. Candle patterns such as the evening star or bearish engulfing, appearing after an uptrend on the PSX charts, often indicate a shift to a downtrend. However, the pattern gains trust when it coincides with other signs, like breaking below a support level or negative volume confirmation. This helps prevent premature exits or entries.
Not all candle patterns predict reversals; some signal trends will continue. Patterns like three white soldiers or rising three methods indicate that buyers remain strong, giving traders an reason to hold positions. For instance, a bullish candle sequence alongside a rising moving average in cement sector stocks supports continuation rather than reversal.
Relying solely on candle patterns without risk management can be hazardous. Setting stop losses just below support zones or the candle low protects capital from sudden swings, especially in Pakistan’s often volatile markets. It's wise to define risk-reward ratios before each trade and avoid overtrading on enticing-looking but weak patterns.
Ignoring volume: Taking candlestick signals without checking volume misleads many traders.
Overvaluing single candle patterns: Patterns must form in context, not isolated.
Skipping confirmation: Entering trades without waiting for other signals increases losses.
Neglecting market news: Sudden political or economic events can override technical cues.
Trading successfully in Pakistani markets demands combining candle patterns with volume, trend tools, and solid risk control. This method boosts confidence and trims guesswork for more effective strategies.
Candle chart patterns reveal much about market behaviour, especially price trends and potential reversals. Knowing signals like the Doji, Hammer, and Engulfing patterns helps traders pinpoint moments when buyers or sellers might take control. For instance, a bullish engulfing pattern appearing after a downtrend in PSX shares often signals a buying opportunity. However, candle patterns alone can't ensure success; combining them with volume data, support and resistance levels, or moving averages in the Pakistani market sharpens accuracy. Skilled traders avoid rushing in immediately—waiting for confirmation keeps risk in check.
Mastering candle patterns requires patience, practice, and context to translate these visual cues into profitable trades.
Recommended Pakistani market courses
Courses specifically aimed at Pakistan's financial landscape provide context often missing from generic international content. Institutes like the Pakistan Institute of Technical and Vocational Education offer technical analysis training focussing on PSX and Karachi-based commodity markets. Enrolling in such courses can teach you not only candle patterns but also their interaction with local economic events, rupee fluctuations, and sector-specific trends. These courses often include live trading sessions which are valuable for applying theory on real-time market moves.
Useful books and websites
Books such as "Technical Analysis of the Financial Markets" by John Murphy remain classics, but pairing these with Pakistan-centric insights sharpens understanding. Websites like ProPakistani and Profit by Pakistan Today regularly feature analysis relevant to domestic traders, including guides and market commentary that integrate candlestick concepts. Using these resources side-by-side offers both foundational knowledge and on-the-ground perspectives.
Practical exercises for traders
The best way to learn candlestick reading is by active practice. Start with historical data from Karachi Stock Exchange (now PSX), picking days when clear candle patterns emerged and compare your predictions to actual price moves. You can use charting software or even Excel to mark candlestick formations and track performance. Try paper trading accounts with local brokers to test your entry and exit strategies based on candle signals without risking money. This hands-on approach boosts confidence and helps internalise pattern recognition effectively.
Developing a strong grip on candle patterns demands continuous learning and real-market exposure. By combining formal education with self-study and practical exercises, Pakistani traders can navigate the market with greater precision and confidence.
Master candlestick patterns 🕯️ in trading! Learn how single, double & triple formations guide smarter market moves & boost your investing skills 📈.
📉 Learn how to spot bearish chart patterns in trading, understand what they mean for price drops, and apply smart risk management to protect your investments.

📈 Explore key chart patterns traders use to spot market moves. Learn how continuation & reversal signals guide smarter trading decisions in Pakistan's markets.
📈 Learn seven key chart patterns to sharpen your trading skills in Pakistan. Discover their formation, use, and practical tips to trade smarter today!
Based on 7 reviews