
Understanding Bearish Chart Patterns in Trading
📉 Learn how to spot bearish chart patterns in trading, understand what they mean for price drops, and apply smart risk management to protect your investments.
Edited By
Oliver Bennett
Understanding trading chart patterns is a key skill for anyone involved in the stock market, forex, or cryptocurrency trading. These patterns help traders predict potential price movements by analysing historical data visually. In Pakistan and worldwide, traders rely on pattern recognition to spot trading opportunities and reduce risks.
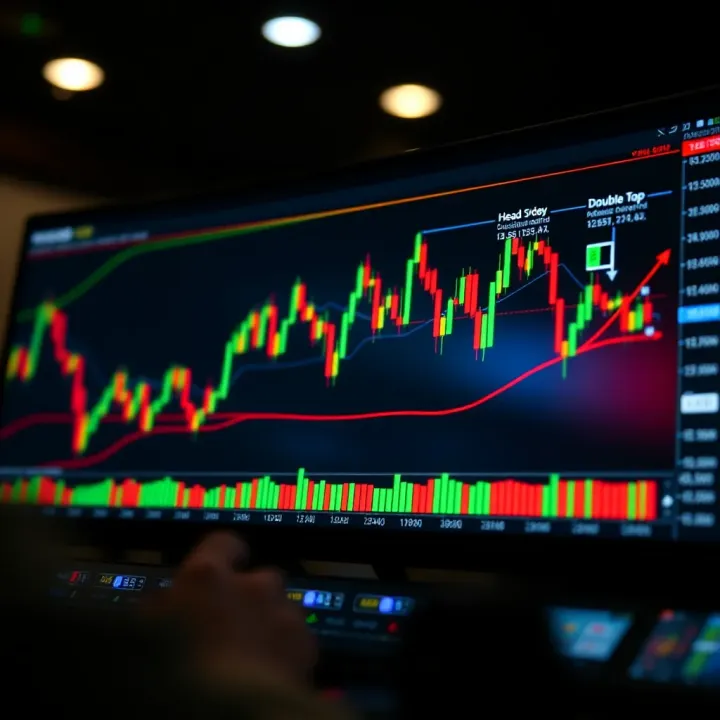
Charts display price movements over time, and patterns form as prices move up, down, or sideways. Recognising these shapes helps you gauge market sentiment—whether buyers are growing stronger or sellers gaining control. For instance, a head and shoulders pattern often signals a trend reversal, while a flag pattern suggests price continuation.
Traders in Pakistan use chart patterns alongside technical indicators like moving averages or RSI to confirm their decisions before entering or exiting trades. Whether you are trading PSX shares, forex pairs, or cryptocurrencies like Bitcoin and Ripple, chart patterns provide practical insights.
Effective trading depends on discipline and knowledge. Chart patterns equip you to make decisions backed by price behaviour, not just guesswork.
Several key patterns appear repeatedly across different markets:
Triangles (ascending, descending, symmetrical) usually indicate potential breakouts or breakdowns.
Double tops and bottoms highlight possible trend reversals.
Cup and handle patterns often suggest a bullish breakout.
Using PDFs that compile these patterns with clear visuals and explanations can make learning easier. Many Pakistani traders download these handy guides to study at their pace during market breaks or while commuting. These PDFs typically include step-by-step guides on spotting each pattern, examples from real market charts, and tips on managing trades based on pattern signals.
To benefit fully, pair your study of chart patterns with practical trading experience. Most importantly, always apply stop-loss orders to protect your capital if the market moves against your prediction. This combined approach improves your chances of success in the fast-paced trading environment of Pakistan's markets or global exchanges.
Trading chart patterns serve as a visual framework helping traders and investors spot probable price moves in financial markets. These patterns emerge from the fluctuating price actions and can offer clues about market sentiment and future trends. For traders in Pakistan and beyond, understanding these patterns helps in making more informed buy or sell decisions rather than relying on guesswork.
Chart patterns are specific formations created by the price movements of securities, displayed on different types of charts like candlestick or line charts. These formations appear when prices move in recognizable shapes such as triangles, flags, or head and shoulders. For example, a head and shoulders pattern often signals an upcoming trend reversal. Recognising these lets traders anticipate whether a stock or currency pair will continue in its current direction or change course.
Charts are usually drawn using historical pricing data and can range from a few minutes to months, depending on the trader’s time frame. Learning to read these patterns equips a trader with a toolkit for timing entries and exits, improving risk management.
Spotting chart patterns quickly can be a game changer in fast-moving markets like the Pakistan Stock Exchange (PSX) or Forex. These patterns reflect the collective psychology of market participants, indicating when optimism might be fading or when fear is taking over. For instance, a double bottom formation might suggest a stock’s price has found a strong support level, encouraging traders to buy.
Moreover, patterns often repeat because human behaviour around price movements tends to be consistent. This consistency is why traders use historical pattern analysis as a guide, reducing emotional biases. Pakistani traders who combine pattern recognition with volume and time-frame analysis usually see better trading outcomes.
Recognising chart patterns isn't about predicting the future with certainty but rather managing probabilities, which is vital for effective trading.
In practice, understanding patterns helps traders decide when to enter a trade with confidence or set stop-loss limits to limit losses. This is especially useful in markets affected by volatility, such as during political developments or economic announcements in Pakistan.
Clear knowledge of chart patterns can significantly improve decision-making, making it a core skill for anyone serious about trading or investing in Pakistan’s financial markets.
Understanding common chart patterns is essential for traders aiming to read price movements accurately and make informed decisions. These patterns offer clear signals about possible trend reversals or continuations, helping traders time their entries and exits more effectively. In Pakistani markets, where volatility can spike unexpectedly due to political or economic events, recognising these patterns quickly can protect capital and optimise profits.

Reversal patterns signal when an existing trend is likely to change direction. The Head and Shoulders pattern, for example, shows a peak (the head) between two smaller peaks (the shoulders). When the price breaks the neckline, it usually marks a strong reversal. Consider a case on the Pakistan Stock Exchange (PSX) where a company's stock rallies but forms this pattern alone the way; spotting it could save a trader from a big loss by exiting before the downtrend.
Similarly, Double Top and Double Bottom patterns appear when the price hits a high or low point twice before reversing. These are simpler but equally powerful signs. For instance, a double bottom forming near an important support level in forex pairs like USD/PKR could indicate a buying opportunity.
Continuation patterns suggest the existing trend will keep going after a short pause. Flags resemble small rectangles that slope against the trend and usually indicate sharp rallies or falls will resume. For Pakistani stock traders, spotting a flag during a rally could mean a good chance to hold or add to positions.
Pennants look like small symmetrical triangles and form after a strong price move. When the breakout happens, it typically continues the previous trend. For example, a pennant in the oil sector stocks during geopolitical tensions might predict further price jumps.
Triangles come in ascending, descending, and symmetrical forms and act as consolidations before a breakout. They are especially useful in volatile markets like PSX, signalling continuation or sometimes reversal depending on breakout direction.
Unlike reversal or continuation patterns, bilateral patterns, such as Symmetrical Triangles and Rectangles, indicate uncertainty about future direction. They prepare traders to watch for a breakout either way.
For instance, in the currency market, a symmetrical triangle might form when the USD/PKR pair is trading within a narrowing range. Traders keep an eye out for breakout above resistance or below support to decide whether to buy or sell.
Recognising bilateral patterns helps manage risk by emphasising the need to confirm breakout direction before making trades.
In all cases, combining pattern recognition with volume analysis and time frames improves reliability. Patterns alone don’t guarantee outcomes but provide strong clues when combined with market context and trading strategy.
Mastering these common chart patterns equips traders with practical tools to read price action confidently, especially in markets like Pakistan’s where dynamic changes are frequent and impactful.
Understanding how to read and interpret chart patterns is essential for traders who want to make informed decisions. These patterns provide clues about market sentiment and potential price movements, especially when spotted correctly on trading platforms frequently used in Pakistan, such as MetaTrader, TradingView, and EasyTrade. Paying attention to the details of pattern formation helps traders anticipate market turns or continuation, reducing guesswork.
Learning to spot chart patterns on trading platforms is the first skill you need. Patterns such as head and shoulders, triangles, or flags will often take shape through connecting trend lines on price charts. For instance, in the case of a double bottom, you might observe two clear dips followed by a rising price, hinting at a reversal. Use drawing tools available in platforms like TradingView to mark support and resistance lines, which define the pattern boundaries. Practising this regularly with live charts sharpens your eye for emerging setups.
Volume plays a key role in validating chart patterns. A breakout from a pattern accompanied by increased trading volume confirms the move’s strength. For example, if you see a pennant forming in the Pakistan Stock Exchange (PSX) indices and the breakout happens with volume spiking, it is a stronger signal than a breakout with low volume. Besides volume, consider multiple time frames. A pattern forming on a daily chart carries more weight than one visible only on a one-minute chart, which may be noise. Combining time frames ensures you don’t fall for false signals in volatile markets.
One common pitfall is mistaking random price movements for valid patterns. Not every dip or surge forms a meaningful shape. Traders often jump into trades prematurely without waiting for confirmation, like a breakout from support/resistance. Also, ignoring volume or relying solely on pattern shape can lead to false entries. Another mistake is overcomplicating analysis by chasing too many patterns at once, leading to confusion rather than clarity. Sticking to a few patterns and confirming them with volume and time frame checks keeps your trades more reliable.
The key is patience and practice – the more time you spend recognising genuine pattern formations and combining them with volume cues and time frame context, the better your trading decisions will become.
By mastering how to read chart patterns with these guidelines, traders in Pakistan can improve their timing and reduce losses caused by misinterpretation. Consistent practice using PDF guides and live charts makes identifying and interpreting patterns a more straightforward part of your daily trading routine.
Having a solid resource to refer to can make all the difference in mastering trading chart patterns. PDFs are particularly useful for traders because they offer a portable, easy-to-access guide that can be reviewed offline at any time. In Pakistan’s trading community, where steady internet access might occasionally falter, PDFs become even more valuable as reliable study tools.
You should look for PDF guides offered by reputable financial education platforms and well-known traders who have a strong track record, preferably within markets similar to Pakistan’s. Websites like Investopedia, BabyPips (for forex patterns), and local brokerage houses sometimes share free or paid downloadable PDFs. Federal Board of Revenue (FBR) or Pakistan Stock Exchange (PSX) educational portals occasionally provide basic guides on technical analysis useful for beginners. Avoid random files from unsecured sources as the information may be outdated or incorrect.
PDF charts allow you to study and familiarise yourself with pattern shapes and characteristics without relying on screen time alone. They give traders a chance to annotate, highlight, or bookmark key sections, which helps in quick revision before entering the market. Unlike video tutorials or webpages, PDFs remain static and focused, making it easier to concentrate. Moreover, having quick access to printouts during market hours can aid in comparing live charts side by side with ideal patterns.
For example, if you spot a potential head and shoulders pattern forming during intraday trading on PSX, you can quickly refer to your PDF guide to verify whether the volume and neckline behaviour match the textbook case.
Start your day by reviewing your PDF charts during your market prep time, particularly focusing on the specific patterns you plan to watch for. Keep the PDF open on your mobile or tablet as a checklist while analysing live charts on your trading platform. Regularly update your PDF collection as you gain experience or discover new pattern types relevant to your trading style.
Traders can also use annotated PDFs to backtest patterns found in historical data, making the learning process active rather than passive. Besides, PDFs can be integrated into group study or trading pauses, allowing discussions backed with visual examples.
Having reliable PDF resources handy means you’re not relying solely on memory or inconsistent web content; it’s like carrying a trusted mentor in your pocket for timely consultation. This habit increases confidence, especially in Pakistan’s often volatile markets where swift decisions matter.
Through careful selection and consistent use of PDF guides, you can sharpen your chart pattern skills, avoid common pitfalls, and improve your timing when making trades. Treat these PDFs as living documents—update, review, and apply their lessons regularly for best results.
Understanding how to apply trading chart patterns in Pakistan's markets demands attention to local specifics like volatility, liquidity, and economic events. These factors shape price action differently compared to more stable markets, meaning that simply copying strategies from global settings can mislead traders here.
Pakistani markets, including the Pakistan Stock Exchange (PSX) and forex segments like USD/PKR trading, often show sharp price swings influenced by political developments, monetary policy changes by the State Bank of Pakistan (SBP), or external shocks such as commodity price fluctuations. Traders should adapt classic chart patterns by considering wider stop-loss margins to avoid premature exits during sudden volatility bursts. For example, a double bottom pattern in PSX might form over several days with erratic price jumps due to political uncertainty, requiring patience and confirmation from volume spikes before acting.
Additionally, market sessions around major news releases like SBP’s policy rate announcements or IMF program updates tend to break pattern rules temporarily. Incorporating awareness of such timing can improve how chart patterns inform decision-making.
Chart patterns work best not in isolation but when combined with indicators such as Relative Strength Index (RSI), Moving Averages, or support/resistance levels tailored for Pakistani markets. For example, a head and shoulders pattern on KSE-100 might be confirmed more reliably when RSI signals overbought conditions. Similarly, spotting a pennant pattern alongside increasing volumes through JazzCash or Easypaisa trading activity data can hint at stronger trend continuation.
Technical tools like Fibonacci retracements adjusted to domestic price scales help pinpoint entry and exit better. Pakistani traders should also factor in fundamental signals like corporate earnings announcements, rupee depreciation trends, or political stability indexes alongside patterns to enhance forecast accuracy.
Consider FX trading where USD/PKR charts frequently produce flag formations as the rupee reacts to fiscal deficits or remittance inflows. For instance, during the budget announcement in June, traders noticed breakout patterns followed by sharp retracements reflecting market sentiment changes. Applying classic flag or triangle patterns with local market context and volume checks allowed traders to manage risks effectively.
At PSX, a recent case included a double top pattern in a banking sector stock amid rising interest rates. Traders who combined this with overall market bearish trends and volume decline avoided losses despite initial false breakouts common to this market’s nature.
In short, successful application of chart patterns requires a fine balance between understanding global trading rules and Pakistan’s unique market behaviour. Tailoring your approach helps navigate volatility and spot real signals amid noise.
By blending local market insights with technical patterns and complementary tools, Pakistani traders can sharpen their strategies and improve outcomes in both stock and forex markets.
📉 Learn how to spot bearish chart patterns in trading, understand what they mean for price drops, and apply smart risk management to protect your investments.

📈 Explore key chart patterns traders use to spot market moves. Learn how continuation & reversal signals guide smarter trading decisions in Pakistan's markets.

Explore essential chart patterns in technical analysis 📊 for smarter trading and investing. Grab downloadable PDFs 📄 to boost your market insights.

📈 Master advanced candlestick patterns in trading! Learn complex signals, risk management, and how to combine candlestick analysis for smarter market moves in Pakistan.
Based on 5 reviews