

Top Crypto Trading Indicators Explained
📊 Discover the best crypto trading indicators that give clear insights and practical tips, helping Pakistani traders make smarter decisions in the market. 🚀
Edited By
Henry Mitchell
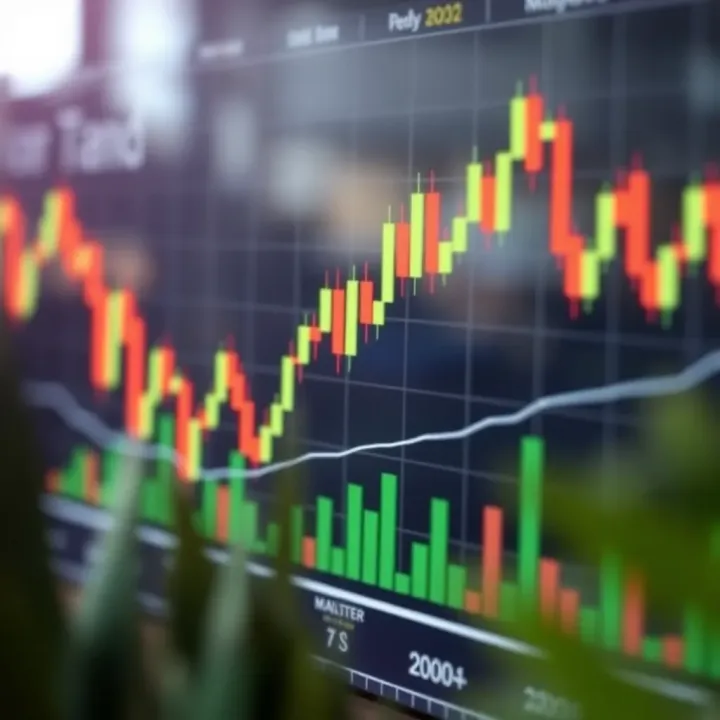
Crypto candlestick patterns offer a straightforward way to track price movements in digital currencies like Bitcoin and Ethereum. These patterns represent price action visually for set periods, such as 15 minutes, one hour, or a day. Each candlestick shows four key prices: open, close, high, and low. Traders in Pakistan’s crypto market can benefit from spotting these shapes to predict future price trends more confidently.
Candlesticks help convert complicated price data into simple bars with a body and wicks, making it easier to recognise buying or selling pressure. For example, a long green body suggests strong buying momentum, whereas a long red body indicates selling pressure. Recognising these patterns quickly can improve decision-making when trading on platforms like Binance Pakistan or local exchanges.
Being familiar with common candlestick shapes reduces guesswork. It alerts you to potential reversals or continuing trends before big price moves happen.
Body: Represents the difference between the opening and closing prices.
Wicks (Shadows): The lines above and below the body showing the price extremes for the period.
Colour: Typically green (or white) means price rose; red (or black) means it dropped.
Understanding these basics allows traders to read charts more effectively. Patterns such as the "hammer," "doji," and "engulfing" offer clues about market sentiment.
When a hammer appears after a downtrend, it may signal a reversal to upwards movement. Pakistani traders can connect this insight with volume data and market news to confirm trades. Similarly, a doji indicates indecision, warning traders to wait before entering positions.
Focusing on these patterns can help mitigate risks in volatile crypto markets common in Pakistan. Identifying reliable candlestick signals alongside other tools reduces the chances of falling for hype-driven pumps or sudden drops.
In short, mastering candlestick patterns sharpens your ability to predict price actions and plan smarter entries and exits. Keeping an eye on these visual signals equips you to react to market swings confidently, within Pakistan’s dynamic crypto trading landscape.
Understanding the basics of crypto candlestick patterns is essential for analysing market behaviour and making informed trading decisions. These patterns visually represent price movements, helping traders identify trends, momentum, and potential reversals in cryptocurrencies like Bitcoin or Ethereum.
Candlestick patterns are formed from individual candlesticks, which consist of three main parts: the body, the wick, and the shadows. The body shows the opening and closing prices within a set time frame, while the wicks or shadows indicate the highest and lowest prices reached during that period. For instance, if the body is long and the wick is short, it suggests strong directional movement.
The shape of the candlestick gives clues about market sentiment. A long body means dominance by buyers or sellers, while long wicks can signal hesitation or a battle between bulls and bears. For example, in volatile Pakistani crypto markets, spotting long wicks might alert you to sudden price swings due to external news or regulatory announcements.
A bullish candle means the closing price is higher than the opening price, reflecting upward price movement. It usually appears as a green or white candle on charts. Conversely, a bearish candle closes lower than it opens, indicating selling pressure, often coloured red or black.
Recognising these differences helps traders gauge market momentum instantly. Say Bitcoin’s price opens at Rs 5,000,000 and closes at Rs 5,100,000 — this bullish candle signals strong buying interest. A series of bearish candles could warn you about downtrends ahead, prompting cautious trading.
Candlestick patterns are more than just visuals; they are tools to anticipate future price movements. In crypto trading, especially on Pakistani platforms like Binance or local exchanges, quick and accurate reading of these patterns can give you an edge. They help in timing entries and exits, optimising profit potential while limiting losses.
Since crypto markets are known for sharp swings, relying solely on candlestick shapes without context may lead to mistakes. Integrating patterns with volume data and technical indicators improves reliability. For example, a hammer candlestick at support level with rising volume often signals a possible trend reversal.
Candlestick charts can be viewed on different time frames — from minutes to days or weeks. The chosen time frame greatly affects the pattern’s meaning. Short-term charts like 5-minute or 15-minute candles reveal immediate price action, useful for day traders. Longer frames such as daily or weekly candles show broader trends beneficial for swing or position traders.
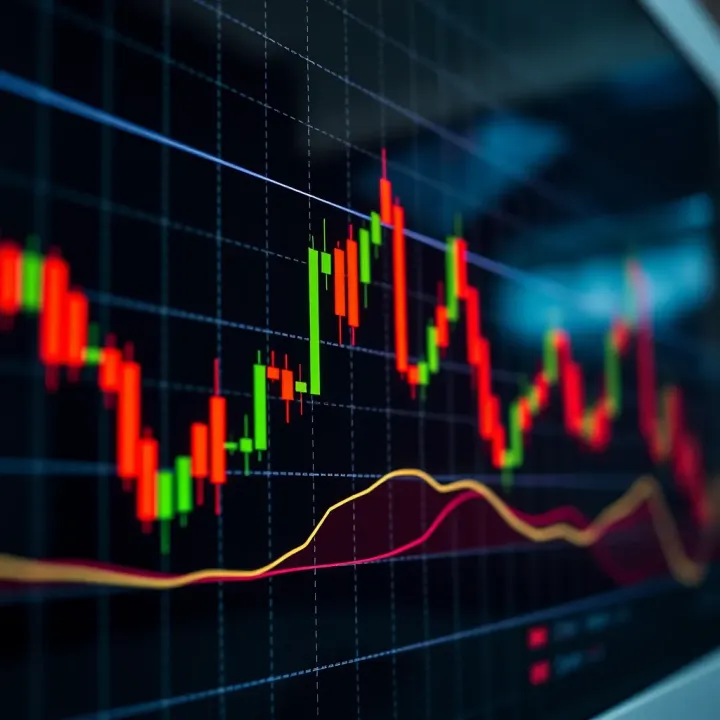
For Pakistani crypto traders, understanding time frames helps align trading strategies with market volatility. A hammer on a daily chart holds more weight than one on a 5-minute chart, where noise is higher.
Price action is about analysing how candlesticks behave rather than relying solely on indicators. Each candle tells a story about supply and demand within that period. Observing sequences of candles can reveal whether buyers or sellers have momentum.
For instance, several consecutive bullish candles with little wick suggest strong buying drive, whereas candles with long upper wicks indicate selling pressure near resistance levels. Such direct reading of price action is especially handy in crypto, where sudden news impacts market sentiment fast.
Learning to spot these candle clues sharpens your instinct for when to enter or exit trades, creating smarter, more disciplined decisions in Pakistan’s dynamic crypto market.
Recognising common candlestick patterns is a key skill for anyone serious about crypto trading. These patterns reflect how traders are feeling and can hint at what might happen next. By understanding these signals, you can improve your timing when buying or selling digital currencies like Bitcoin, Ethereum, or local favourites on Pakistani exchanges.
Doji: indecision in the market
A Doji candle forms when the opening and closing prices are almost equal, resulting in a very small or nonexistent body. This pattern shows uncertainty among traders — buyers and sellers are more or less balanced. For instance, after a strong upward move, a Doji on a chart may suggest hesitation and a possible slowdown or reversal ahead. However, it alone doesn’t confirm a change; traders should look for confirmation in following candles or volume shifts.
Hammer and Hanging Man: signs of reversal
Both patterns look similar, featuring a small body with a long lower wick. A Hammer appearing after a downtrend signals that buyers are stepping in to support prices, possibly indicating a bullish reversal. Conversely, a Hanging Man after an uptrend warns that sellers might soon gain control, hinting at a bearish reversal. For example, if Bitcoin’s price falls sharply all day but closes near the high, it's a Hammer that traders watch closely for a bounce.
Shooting Star: warning of decline
This candle has a small body near the day's low and a long upper wick, suggesting that buyers pushed prices up but sellers took over before the close. It usually appears after an advance, signalling that the upward momentum is losing strength. Seeing a Shooting Star on a crypto chart could be an alert to tighten stop-loss orders or prepare for a potential drop.
Bullish and Bearish Engulfing
The Bullish Engulfing pattern happens when a small bearish candle is followed by a larger bullish candle that completely covers it. This suggests a strong shift in favour of buyers. The Bearish Engulfing is the opposite, signalling sellers taking over. On Pakistani crypto platforms like Binance or local exchanges, spotting these patterns, especially on higher time frames, helps confirm entry or exit points.
Morning and Evening Star
The Morning Star is a three-candle bullish reversal pattern: a large bearish candle, followed by a small indecisive candle (like a Doji), then a big bullish candle. This shows markets finding a bottom and buyers gaining confidence. The Evening Star flips this around, signalling a bearish reversal after a rally. Traders use these patterns to gauge momentum shifts and adjust positions accordingly.
Three White Soldiers and Three Black Crows
Three White Soldiers consist of three consecutive bullish candles, each closing higher, reflecting sustained buying pressure. On the flip side, Three Black Crows are three bearish candles closing lower, indicating strong selling. These patterns suggest continuation of a trend and can validate other technical signals. For instance, if you spot Three White Soldiers after a consolidation phase in Ethereum’s chart, it might be wise to prepare for further gains.
Successful trading often depends on combining these patterns with volume and other indicators. Remember, no pattern works every time, but understanding their meaning gives you an edge in navigating Pakistan's volatile crypto market.
Candlestick patterns are more than just visual aids; they form a practical toolkit for traders to make calculated decisions. In crypto trading, where price swings can be sharp and sudden, recognising these patterns helps you read market sentiment effectively. Through patterns, you get clues about when buyers or sellers might take control, allowing you to plan entries and exits with more confidence.
Volume acts as a reality check for candlestick patterns. A pattern appearing on low volume could be less reliable as it may not reflect genuine interest. For example, a bullish engulfing pattern accompanied by higher-than-usual trading volume confirms that many traders back the move, increasing the chance of a trend reversal. Conversely, if the volume is weak, the price action might fizzle out quickly, causing false signals.
Besides volume, pairing candlestick patterns with indicators like the Relative Strength Index (RSI) and moving averages adds layers to your analysis. RSI can show if a cryptocurrency is overbought or oversold; spotting a hammer candle when RSI is below 30 (oversold) strengthens your buy signal. Moving averages help to identify the overall trend direction. If a bullish pattern forms near a rising 50-day moving average, the odds favour a sustained upward move. This combined approach improves your chance to avoid traps and act when momentum builds.
Setting clear stop-loss and take-profit levels based on candlestick signals is essential for protecting your capital. For instance, if a shooting star forms signaling a potential drop, a stop-loss just above the candle’s high limits losses if the market moves against you. Similarly, take-profit targets can be placed near previous support or resistance levels shown on the chart, allowing you to lock gains without getting greedy.
Using candlestick patterns for risk management means not just timing when to trade but also deciding how much you are willing to risk. For example, if a double top pattern forms, it signals a possible bearish reversal; you might reduce your position size or tighten stops to limit exposure. Trading without clear pattern-based rules can lead to emotional decisions and bigger losses, especially in Pakistan’s sometimes volatile crypto market.
Combining candlestick patterns with volume and technical indicators helps confirm trading signals, while disciplined entry, exit, and risk controls turn those signals into effective trading strategies.
By paying attention to these aspects, you can enhance your trading discipline, reduce costly mistakes, and better navigate the rapidly moving crypto markets.
Spotting when a trend in crypto markets shifts direction is vital for traders aiming to protect gains or limit losses. Candlestick analysis offers visual clues that highlight these trend changes before they fully play out. By interpreting specific patterns, traders can make informed decisions to enter or exit trades at smarter points, rather than reacting too late.
Reversal signals indicate that the current price trend — either up or down — might be about to change course. For example, a bullish reversal suggests prices could move higher after a downtrend, while a bearish reversal warns of possible decline following an uptrend. Key reversal patterns include the Hammer, Inverted Hammer, Shooting Star, and Engulfing candles. These candles reflect shifts in market sentiment, like buyers stepping in or sellers gaining control.
These patterns become especially relevant in crypto's volatile high-speed environment, where a sudden reversal can wipe out profits or deepen losses quickly. Observing reversal patterns lets you anticipate these turns. For instance, spotting a Bullish Engulfing pattern on Bitcoin's daily chart amid a downtrend signals buyers pushing prices above prior levels — a practical cue to consider going long.
In early 2023, Ethereum's price showed a classic Morning Star pattern after several days of decline, combining a bearish candle, a small-bodied candle, and a bullish candle. This pattern indicated diminishing selling pressure and the rise of buyers, heralding a trend reversal. Traders who caught this signal gained early entry into the next upward move.
Similarly, a Bearish Engulfing pattern appeared on Binance Coin's charts before a notable price drop. Experienced traders used this cue to exit their positions or place stop-loss orders, protecting capital from the downturn. Such examples affirm how familiar candlestick patterns aid decision-making in fast-moving crypto markets.
Continuation patterns suggest the existing trend will likely persist rather than reverse. Common continuation patterns include the Rising Three Methods, Falling Three Methods, and flags or pennants. These patterns reflect short pauses or consolidations in the market before the original trend resumes.
Recognising these patterns helps traders avoid premature exits. For example, during Bitcoin’s upward momentum in 2024, several flag patterns formed, signalling brief pullbacks followed by trend continuation. Traders familiar with these setups maintained confidence to hold or add positions rather than panic selling.
When continuation signals appear, traders can adjust their strategies by setting tighter stop-loss levels to protect gains while staying in the trend. These patterns offer chances to enter on pullbacks with clearer exit rules in place. Ignoring continuation patterns often leads to missed opportunities or knee-jerk reactions to normal market fluctuations.
In Pakistani trading contexts, where market volatility can be pronounced, correctly interpreting continuation patterns may help navigate loadshedding-driven liquidity drops or sudden spikes due to local events. Overall, spotting both reversals and continuations sharpens trading strategy, reducing risk and boosting confidence in market timing.
Candlestick patterns are more than just shapes; they narrate the tug of war between buyers and sellers. Learning to read them closely lets you capture important trend changes early, which can make all the difference in crypto trading.
Trading cryptocurrencies with candlestick patterns offers great insight, but it also comes with pitfalls. Many traders, especially beginners, fall into common traps that lead to costly errors. Understanding these mistakes and adopting practical tips can improve your trading decisions significantly, especially in Pakistan's fast-moving crypto markets.
Candlestick patterns sometimes send false signals because they boil down to probabilities, not certainties. For example, a single bullish engulfing candle might promise a price rise, but if the overall market sentiment is bearish, that bullish signal could fail. This happens often during volatile times or when market news causes sudden price shifts unrelated to technicals.
Context is everything when interpreting these patterns. Confirming a candlestick pattern with additional indicators, like trading volume or the Relative Strength Index (RSI), reduces the chance of acting on misleading signals. Without such confirmation, traders risk entering or exiting positions prematurely, which can affect their profitability.
Successful trading using candlesticks depends more on confirmation than on spotting patterns alone.
Cryptocurrency markets in Pakistan face high volatility and market noise, often intensified by global events and local regulations. Managing this volatility means not relying solely on single candlesticks but observing patterns over multiple timeframes and combining them with volume and trend indicators. For instance, a pattern on a five-minute chart might be noise, while the same on a daily chart could indicate a real move.
When it comes to using local exchanges like Binance Pakistan or local OTC desks, security and reliability matter. Always use exchanges that comply with Pakistan Telecommunication Authority (PTA) regulations and have strong KYC (Know Your Customer) protocols to protect your investment. Also, be cautious of pump-and-dump schemes common on smaller platforms.
Besides, utilise mobile apps from trusted providers such as JazzCash and Easypaisa for smooth deposit and withdrawal handling. Ensure your devices have updated security software to guard against cyber threats, which are frequently reported in the Pakistan crypto space.
By staying aware of these pitfalls and adopting a disciplined approach, Pakistani traders can make smarter decisions and reduce risks related to crypto candlestick trading.
📊 Discover the best crypto trading indicators that give clear insights and practical tips, helping Pakistani traders make smarter decisions in the market. 🚀

🔍 Find the best crypto trading platform in Pakistan! Compare fees, security, payment options, and local regulations to trade smart and safe. 🇵🇰💰

Looking for the best crypto trading app in Pakistan? 🤑 Discover top picks with strong security, easy use, local features, and regulatory safety! 📱💰
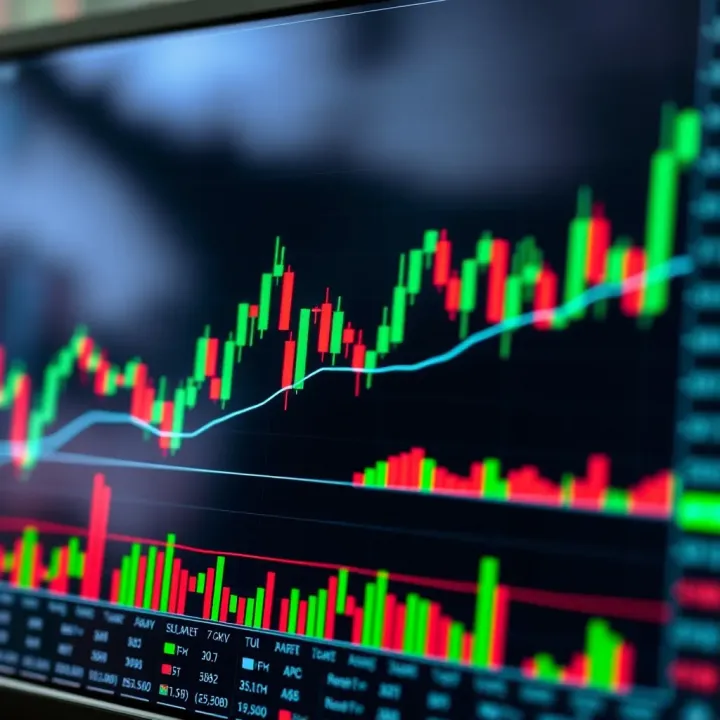
Master candlestick patterns 🕯️ in trading! Learn how single, double & triple formations guide smarter market moves & boost your investing skills 📈.
Based on 11 reviews